The stock has decisively broken out of a 3-month consolidation phase. This technical breakout is powered by a strong fundamental catalyst (Q2 earnings), validating the surge and the high volume.
🚀 1. The Fundamental Catalyst (The "Why")
The breakout is a direct reaction to the company's Q2 FY26 Earnings announced today:
- Net Profit: Jumped 30% YoY to ₹258 crore.
- Revenue: Grew 20% YoY to ₹1,644 crore.
- Market Reaction: This stellar performance triggered the massive gap-up and volume spike, confirming that institutional money is chasing the stock.
📈 2. The Chart Structure (The "Setup")
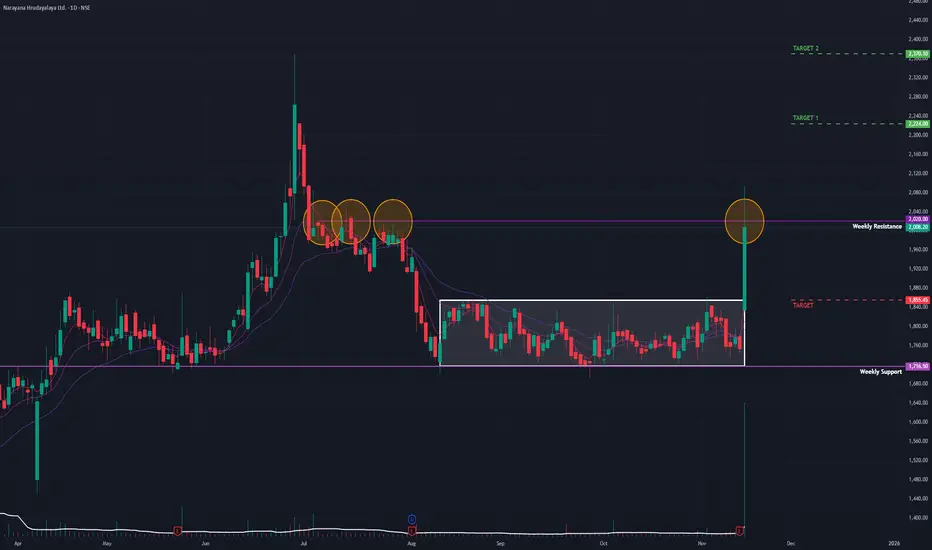
- The Correction: After the June 2025 peak, the stock saw a healthy ~27.5% correction into August.
- The Consolidation: Since August, it formed a classic Rectangular Consolidation Pattern (a "box" range).
- Drying Volume: Volume dried up during this sideways phase—a textbook sign that sellers were exhausted and the stock was being accumulated.
💥 3. The Breakout (Today's Action)
- The Surge: The stock surged 14.53%
- The Volume: The move was backed by massive volume of 13.33 Million shares, the highest in months.
- The Resistance Break: The stock has decisively broken but not closed above the key horizontal resistance from July 2025 (the ₹2,020 level).
📊 4. Technical Indicators
- RSI: The Relative Strength Index is rising across Daily, Weekly, and Monthly timeframes, showing aligned bullish momentum.
- EMAs: Short-term EMAs are in a PCO (Price Crossover) state, signaling a fresh uptrend.
🎯 5. Future Scenarios & Targets
With the rectangular base now broken, the path of least resistance is up.
- 🐂 Bullish Target 1: ₹2,225 (Immediate technical extension).
- 🐂 Bullish Target 2: ₹2,370 (Retest of the All-Time High).
- 🛑 Support (The Safety Net): If the stock pulls back to digest these gains, the top of the rectangle at ₹1,850 should now act as strong support.
🚀 1. The Fundamental Catalyst (The "Why")
The breakout is a direct reaction to the company's Q2 FY26 Earnings announced today:
- Net Profit: Jumped 30% YoY to ₹258 crore.
- Revenue: Grew 20% YoY to ₹1,644 crore.
- Market Reaction: This stellar performance triggered the massive gap-up and volume spike, confirming that institutional money is chasing the stock.
📈 2. The Chart Structure (The "Setup")
- The Correction: After the June 2025 peak, the stock saw a healthy ~27.5% correction into August.
- The Consolidation: Since August, it formed a classic Rectangular Consolidation Pattern (a "box" range).
- Drying Volume: Volume dried up during this sideways phase—a textbook sign that sellers were exhausted and the stock was being accumulated.
💥 3. The Breakout (Today's Action)
- The Surge: The stock surged 14.53%
- The Volume: The move was backed by massive volume of 13.33 Million shares, the highest in months.
- The Resistance Break: The stock has decisively broken but not closed above the key horizontal resistance from July 2025 (the ₹2,020 level).
📊 4. Technical Indicators
- RSI: The Relative Strength Index is rising across Daily, Weekly, and Monthly timeframes, showing aligned bullish momentum.
- EMAs: Short-term EMAs are in a PCO (Price Crossover) state, signaling a fresh uptrend.
🎯 5. Future Scenarios & Targets
With the rectangular base now broken, the path of least resistance is up.
- 🐂 Bullish Target 1: ₹2,225 (Immediate technical extension).
- 🐂 Bullish Target 2: ₹2,370 (Retest of the All-Time High).
- 🛑 Support (The Safety Net): If the stock pulls back to digest these gains, the top of the rectangle at ₹1,850 should now act as strong support.
Disclaimer: This analysis is my personal view & for educational purposes only. They shall not be construed as trade or investment advice. Before making any financial decision, it is imperative that you consult with a qualified financial professional.
Declinazione di responsabilità
Le informazioni e le pubblicazioni non sono intese come, e non costituiscono, consulenza o raccomandazioni finanziarie, di investimento, di trading o di altro tipo fornite o approvate da TradingView. Per ulteriori informazioni, consultare i Termini di utilizzo.