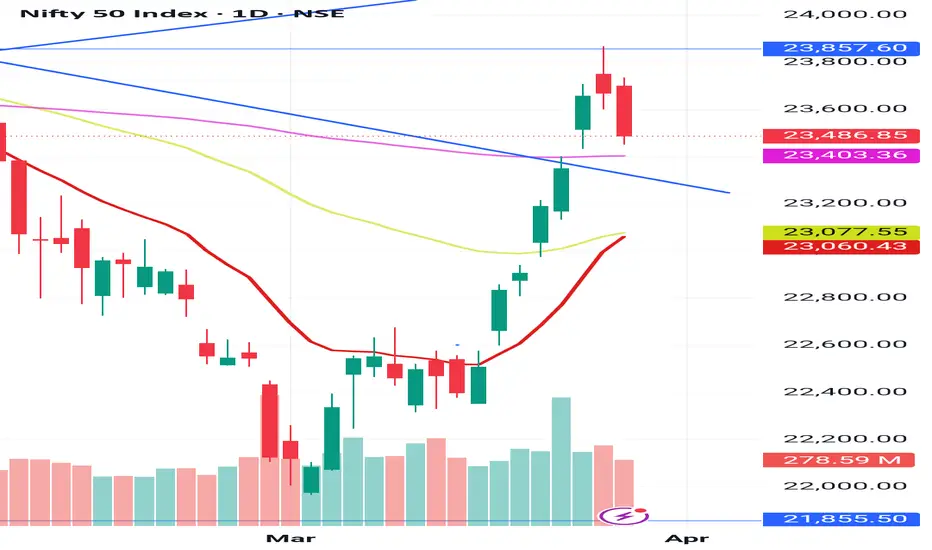
The big bearish candle formed with good volumes in yesterday trading. The candle formation is look like SHOOTING STAR on daily charts after 1500 pts rally from recent lows. If the following candle is red candle it witnessed market enter into a short term bearish trend. The PCR data showing bullish strength in the market.
Support levels : 23400,23303
Resistance levels : 23550,23622
Support levels : 23400,23303
Resistance levels : 23550,23622
Declinazione di responsabilità
Le informazioni ed i contenuti pubblicati non costituiscono in alcun modo una sollecitazione ad investire o ad operare nei mercati finanziari. Non sono inoltre fornite o supportate da TradingView. Maggiori dettagli nelle Condizioni d'uso.
Declinazione di responsabilità
Le informazioni ed i contenuti pubblicati non costituiscono in alcun modo una sollecitazione ad investire o ad operare nei mercati finanziari. Non sono inoltre fornite o supportate da TradingView. Maggiori dettagli nelle Condizioni d'uso.