Nifty 50 - Key Support and Resistance Levels
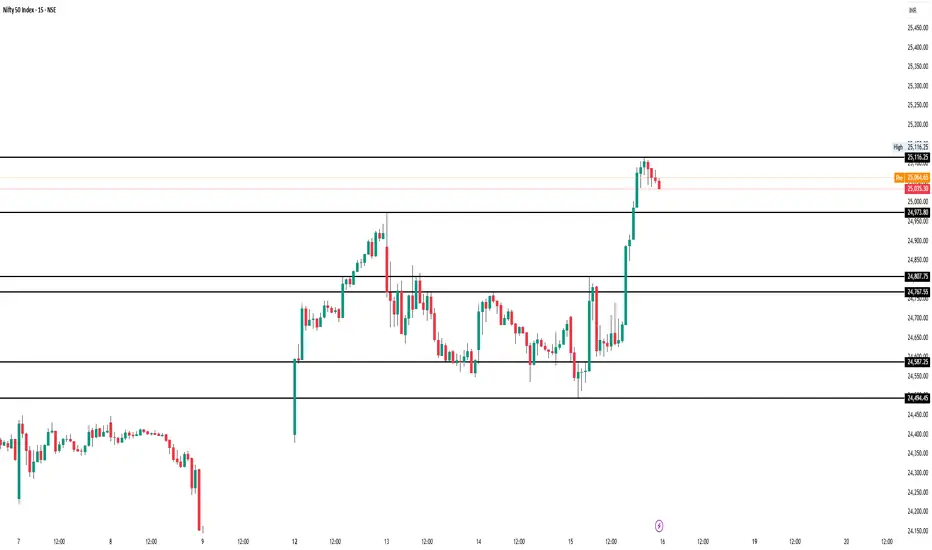
This 15-minute chart for the Nifty 50 index highlights the recent price action with key support and resistance zones clearly marked. After a sharp upward breakout, the index is currently trading around 25,035, facing immediate resistance at 25,116.25. Key support levels to watch include 24,973.80, 24,807.75, 24,767.55, 24,587.25, and 24,494.45, which might act as potential pullback zones in case of a correction.
Keep an eye on volume and price action around these levels for confirmation before taking trades.
Declinazione di responsabilità
Le informazioni ed i contenuti pubblicati non costituiscono in alcun modo una sollecitazione ad investire o ad operare nei mercati finanziari. Non sono inoltre fornite o supportate da TradingView. Maggiori dettagli nelle Condizioni d'uso.
Declinazione di responsabilità
Le informazioni ed i contenuti pubblicati non costituiscono in alcun modo una sollecitazione ad investire o ad operare nei mercati finanziari. Non sono inoltre fornite o supportate da TradingView. Maggiori dettagli nelle Condizioni d'uso.