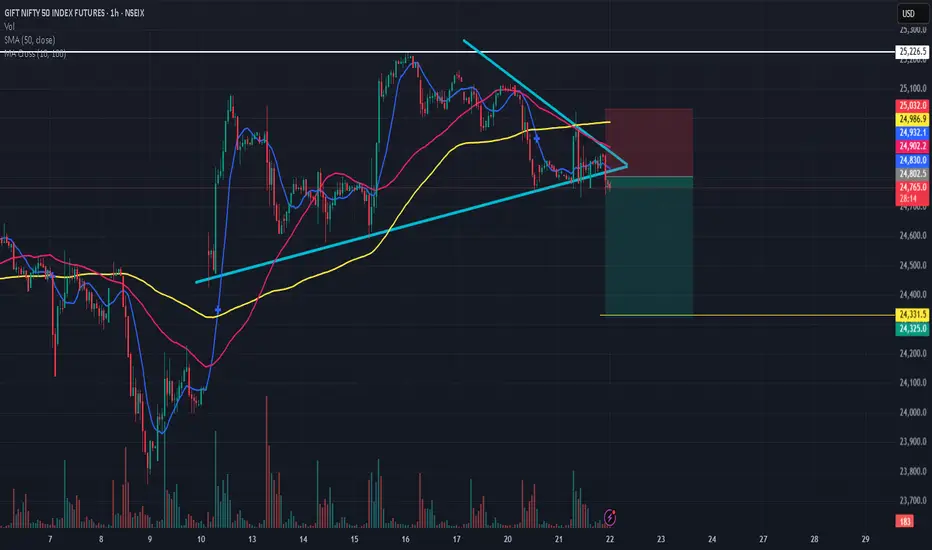
A triangle chart pattern is a tool used in technical analysis. Named for its resemblance to a series of triangles, the triangle chart pattern is created by drawing trendlines along a converging price range. The result signals a pause in the prevailing trend.
Technical analysts read the triangle as an indicator of a continuation of an existing trend or reversal.
Despite being a continuation, traders should look for breakouts before they make a move to buy or sell.
Technical analysts read the triangle as an indicator of a continuation of an existing trend or reversal.
Despite being a continuation, traders should look for breakouts before they make a move to buy or sell.
Declinazione di responsabilità
Le informazioni ed i contenuti pubblicati non costituiscono in alcun modo una sollecitazione ad investire o ad operare nei mercati finanziari. Non sono inoltre fornite o supportate da TradingView. Maggiori dettagli nelle Condizioni d'uso.
Declinazione di responsabilità
Le informazioni ed i contenuti pubblicati non costituiscono in alcun modo una sollecitazione ad investire o ad operare nei mercati finanziari. Non sono inoltre fornite o supportate da TradingView. Maggiori dettagli nelle Condizioni d'uso.