📌 Title:
NASDAQ – 18,000 Holding, But Downside Risk Remains
Review of Last week's outlook:
I said that buying between 18,600 and 18,700 on the 12-hour chart would be reasonable,
but if a 12-hour candle closed below 18,500, it would be a major warning signal.
That strategy was valid at least until Tuesday.
But then three more 12-hour candles formed,
and Tuesday's closing price was 18,938.
The market opened Wednesday with a gap down at 18,790.
Looking at the chart at that time,
price had dropped below the 200-day line on the 2-day chart,
and the 12-hour chart was also not looking good.
So the strategy of buying near 18,600 on the 12-hour chart was no longer valid.
I had mentioned that if a 12-hour candle closed below 18,500,
it could get very dangerous.
And on the 4-hour chart, I had suggested short-term scalping was possible in the low 18,000s.
As expected, there was one bounce from that level,
but the price continued to fall after that.
📋 Description:
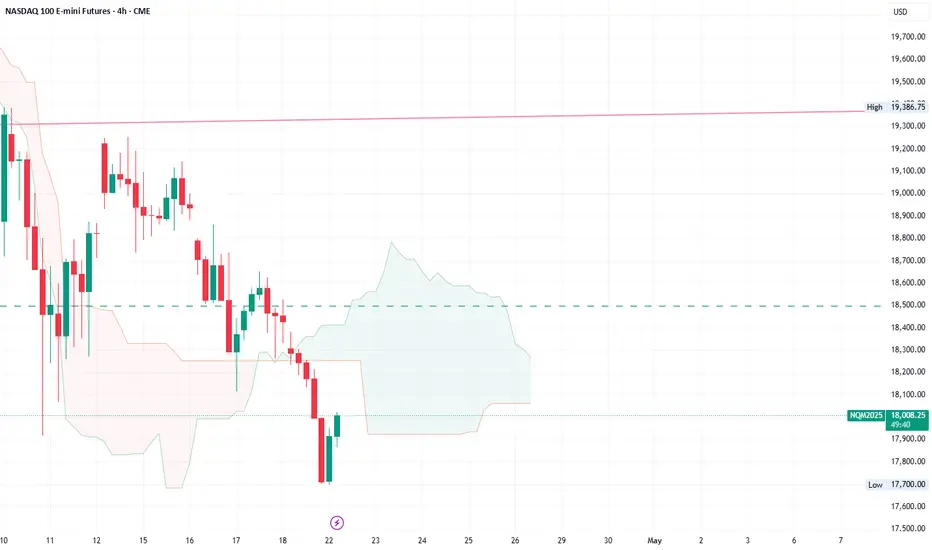
Now, NASDAQ is currently hovering near 18,000.
Although volatility remains low, price action continues to drift lower with weak momentum on higher timeframes.
Key Technical Observations:
• 📉 Still inside the 5-day bullish Ichimoku cloud
• 📍 17,000 = Bottom of the Bi-weekly Kumo + 3D 200SMA
• 📍 16,500 = Previous swing low, potential double bottom area
• 📈 18,400 = Needs to be reclaimed by weekly close to consider range recovery
A clean break below 17,700 could open the path toward 17,000, and possibly lower.
For now, this is a watch-and-react zone not yet a clear buy or sell signal, but conditions are forming for the next move.
🔁 Bias: Neutral to Bearish
⏳ Strategy: Wait for confirmation at 17,700 or breakdown
NASDAQ – 18,000 Holding, But Downside Risk Remains
Review of Last week's outlook:
I said that buying between 18,600 and 18,700 on the 12-hour chart would be reasonable,
but if a 12-hour candle closed below 18,500, it would be a major warning signal.
That strategy was valid at least until Tuesday.
But then three more 12-hour candles formed,
and Tuesday's closing price was 18,938.
The market opened Wednesday with a gap down at 18,790.
Looking at the chart at that time,
price had dropped below the 200-day line on the 2-day chart,
and the 12-hour chart was also not looking good.
So the strategy of buying near 18,600 on the 12-hour chart was no longer valid.
I had mentioned that if a 12-hour candle closed below 18,500,
it could get very dangerous.
And on the 4-hour chart, I had suggested short-term scalping was possible in the low 18,000s.
As expected, there was one bounce from that level,
but the price continued to fall after that.
📋 Description:
Now, NASDAQ is currently hovering near 18,000.
Although volatility remains low, price action continues to drift lower with weak momentum on higher timeframes.
Key Technical Observations:
• 📉 Still inside the 5-day bullish Ichimoku cloud
• 📍 17,000 = Bottom of the Bi-weekly Kumo + 3D 200SMA
• 📍 16,500 = Previous swing low, potential double bottom area
• 📈 18,400 = Needs to be reclaimed by weekly close to consider range recovery
A clean break below 17,700 could open the path toward 17,000, and possibly lower.
For now, this is a watch-and-react zone not yet a clear buy or sell signal, but conditions are forming for the next move.
🔁 Bias: Neutral to Bearish
⏳ Strategy: Wait for confirmation at 17,700 or breakdown
PinoChart
Pino's Market insights & strategy setups & Real-time ideas. Weekly setups.
youtube.com/@피노차트
youtube.com/@pinochart
Pino's Market insights & strategy setups & Real-time ideas. Weekly setups.
youtube.com/@피노차트
youtube.com/@pinochart
Declinazione di responsabilità
Le informazioni e le pubblicazioni non sono intese come, e non costituiscono, consulenza o raccomandazioni finanziarie, di investimento, di trading o di altro tipo fornite o approvate da TradingView. Per ulteriori informazioni, consultare i Termini di utilizzo.