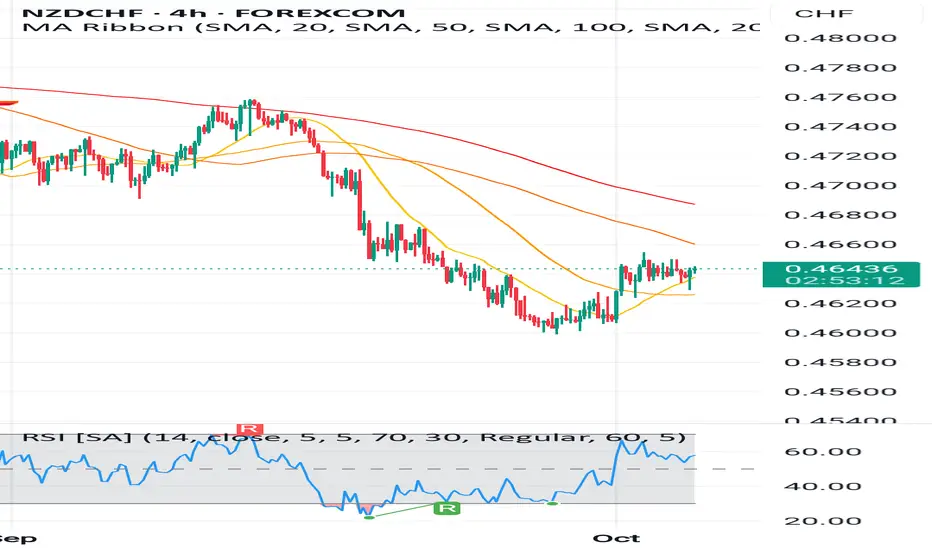
Market recently bounced from below 0.4600, showing short-term recovery.
However, price is still trading below the 50, 100, and 200 SMAs, meaning the overall trend remains bearish.
🔹 Moving Averages (SMA Ribbon)
Price is testing the 20 SMA (yellow line).
The 50 SMA (orange) and 100 SMA (brown) above are acting as strong resistance.
The 200 SMA (red) is far above – unless price breaks 0.4700–0.4720, the downtrend is intact.
🔹 RSI (Relative Strength Index)
RSI is around 60.
Indicates some short-term bullish momentum.
If RSI pushes above 70, it enters overbought zone.
A bullish divergence had formed earlier, which explains the recent bounce.
🔹 Key Levels
Resistance: 0.4660 – 0.4680 (50 & 100 SMA zone), then 0.4720 – 0.4740
Support: 0.4620 – 0.4600 (recent swing low), then 0.4560
🔹 Possible Scenarios
1. Bullish Case (Short-term bounce)
If price sustains above 0.4660, next upside targets are 0.4680–0.4720.
2. Bearish Case (Trend continuation)
If price closes below 0.4620, decline towards 0.4600 and 0.4560 is likely.
📌 Summary:
Short-term: Some bullish recovery.
Medium-term: Still in a bearish trend unless it breaks above 0.4720.
Best approach: Intraday traders can look for selling opportunities near 0.4660–0.4680. If a breakout above 0.4720 happens, then buyers may step in.
Declinazione di responsabilità
Le informazioni ed i contenuti pubblicati non costituiscono in alcun modo una sollecitazione ad investire o ad operare nei mercati finanziari. Non sono inoltre fornite o supportate da TradingView. Maggiori dettagli nelle Condizioni d'uso.
Declinazione di responsabilità
Le informazioni ed i contenuti pubblicati non costituiscono in alcun modo una sollecitazione ad investire o ad operare nei mercati finanziari. Non sono inoltre fornite o supportate da TradingView. Maggiori dettagli nelle Condizioni d'uso.