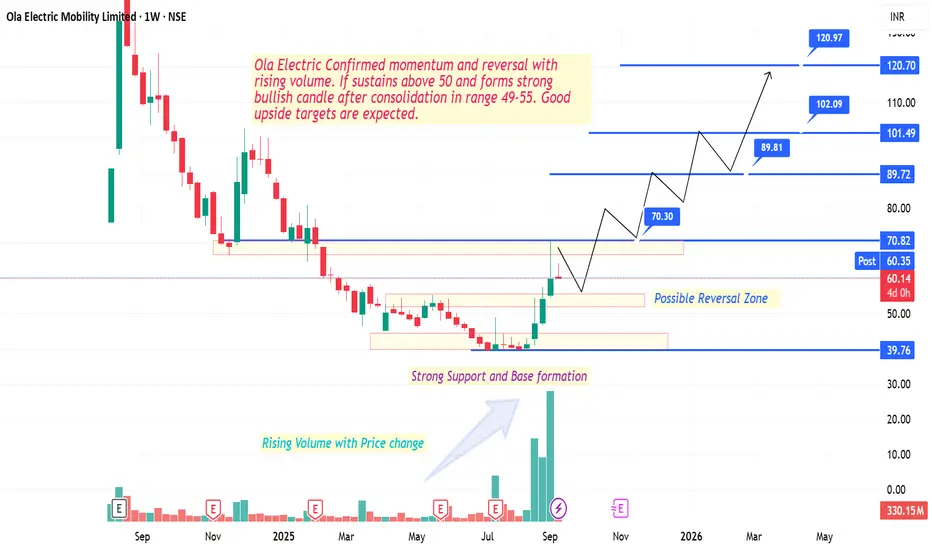
Ola Electric has shown confirmed momentum and reversal with rising volume. After a long consolidation phase between ₹49–55, the stock has broken out with strong bullish candles, supported by heavy volumes – signaling a possible trend reversal.
🔹 Key Technical Observations
✅ Strong base formation and reversal zone around ₹49–55
✅ Rising volumes confirming price momentum
✅ Sustaining above ₹50 adds bullish strength
✅ Next resistance levels:
₹70.30 / ₹70.82
₹89.72 / ₹89.81
₹101.49 / ₹102.09
₹120.70 / ₹120.97
📈 If momentum continues and price sustains above ₹60–65 levels, higher targets can be achieved step by step.
⚠️ Risk Management:
Keep strict stop loss below ₹49 zone (support base) or as per your risk management. Previous swing low is preffered for long term investors.
Partial profit booking near resistance levels is advisable.
Re-entry possible on retest of breakout zones.
#OlaElectric #NSEStocks #MomentumTrading #PriceAction #BreakoutStocks #VolumeAnalysis #StockMarketIndia #SwingTrading #ReversalSetup #TradingViewIndia
Declinazione di responsabilità
Le informazioni e le pubblicazioni non sono intese come, e non costituiscono, consulenza o raccomandazioni finanziarie, di investimento, di trading o di altro tipo fornite o approvate da TradingView. Per ulteriori informazioni, consultare i Termini di utilizzo.
Declinazione di responsabilità
Le informazioni e le pubblicazioni non sono intese come, e non costituiscono, consulenza o raccomandazioni finanziarie, di investimento, di trading o di altro tipo fornite o approvate da TradingView. Per ulteriori informazioni, consultare i Termini di utilizzo.