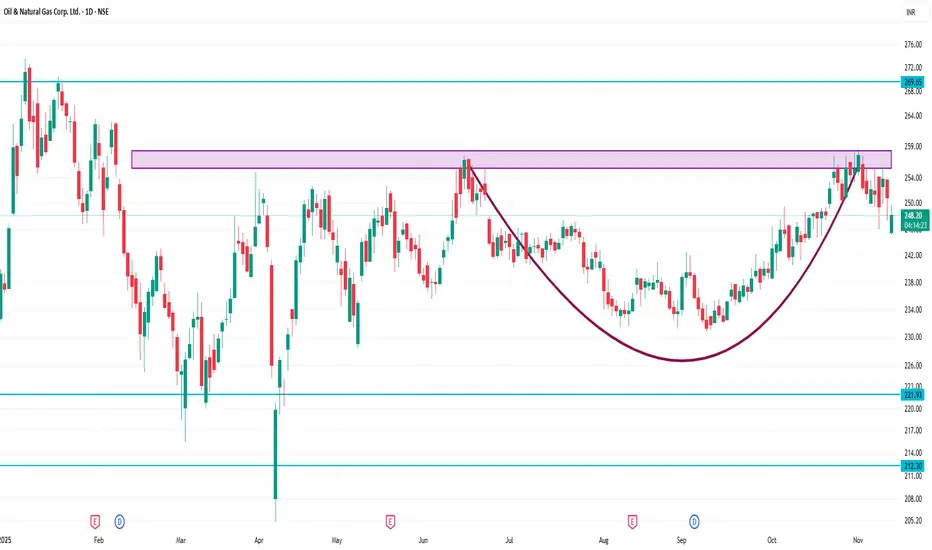
🎯 Key levels to watch on the 1-day chart
Support zone: ~ ₹ 245-243 region (falls in line with support zones and moving average base)
Near support: ~ ₹ 248-250 (if price returns toward pivot/support)
Resistance zone: ~ ₹ 253-257 region (prior resistance, pivot R1, chart resistance).
If ONGC breaks above ~₹ 257 with conviction, next higher resistance might be ~ ₹ 260+ (depending on trend).
If ONGC breaks down below ~₹ 243 (support zone) with volume, possible further drop toward ~₹ 241 or ~₹ 225 in longer term.
Pubblicazioni correlate
Declinazione di responsabilità
Le informazioni e le pubblicazioni non sono intese come, e non costituiscono, consulenza o raccomandazioni finanziarie, di investimento, di trading o di altro tipo fornite o approvate da TradingView. Per ulteriori informazioni, consultare i Termini di utilizzo.