Paras Defence & Space Technologies – Early Buy Signal Appears
Paras Defence & Space Technologies – Early Buy Signal Appears
#PARASDEFENCE
📈Pattern & Setup:
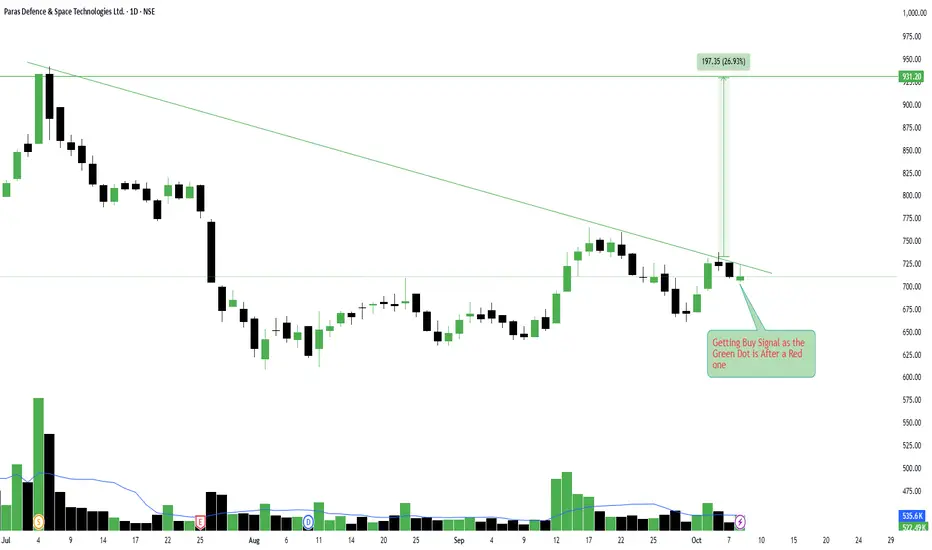
Paras Defence is flashing an early buy signal as the green dot (buy confirmation) appears right after a red one (sell exhaustion), suggesting momentum reversal might be starting.
Price has been consolidating tightly near the descending trendline, and now buyers seem to be stepping in around the 700 zone. This structure is forming a potential descending trendline breakout setup with bullish volume starting to reappear.
Once the stock manages to sustain above 725–730, we can expect strong follow-through buying that could drive prices toward 900+ levels in the coming weeks.
📝 Trade Plan:
Entry: Above 725 on breakout confirmation.
🚩Stop-Loss: 680 (below the recent swing low).
🎯Targets:
Target 1 → 810 (short-term).
Target 2 → 930 (measured move target, ~27% potential).
💡Pyramiding Strategy:
1. Enter partial position near 725 breakout level.
2. Add on strength once price sustains above 750 with rising volume.
3. Trail stop-loss to 705 once price crosses 770.
🧠Logic Behind Selecting this Trade:
The buy signal right after a red exhaustion dot usually indicates a shift in sentiment. Combined with the descending trendline resistance being tested again and a pickup in volume, this looks like a low-risk early entry before breakout confirmation.
Keep Learning. Keep Earning.
Let’s grow together 📚🎯
🔴Disclaimer:
This analysis is for educational purposes only. Not a buy/sell recommendation. Please consult your financial advisor before trading.
#PARASDEFENCE
📈Pattern & Setup:
Paras Defence is flashing an early buy signal as the green dot (buy confirmation) appears right after a red one (sell exhaustion), suggesting momentum reversal might be starting.
Price has been consolidating tightly near the descending trendline, and now buyers seem to be stepping in around the 700 zone. This structure is forming a potential descending trendline breakout setup with bullish volume starting to reappear.
Once the stock manages to sustain above 725–730, we can expect strong follow-through buying that could drive prices toward 900+ levels in the coming weeks.
📝 Trade Plan:
Entry: Above 725 on breakout confirmation.
🚩Stop-Loss: 680 (below the recent swing low).
🎯Targets:
Target 1 → 810 (short-term).
Target 2 → 930 (measured move target, ~27% potential).
💡Pyramiding Strategy:
1. Enter partial position near 725 breakout level.
2. Add on strength once price sustains above 750 with rising volume.
3. Trail stop-loss to 705 once price crosses 770.
🧠Logic Behind Selecting this Trade:
The buy signal right after a red exhaustion dot usually indicates a shift in sentiment. Combined with the descending trendline resistance being tested again and a pickup in volume, this looks like a low-risk early entry before breakout confirmation.
Keep Learning. Keep Earning.
Let’s grow together 📚🎯
🔴Disclaimer:
This analysis is for educational purposes only. Not a buy/sell recommendation. Please consult your financial advisor before trading.
TrendX INC
Pubblicazioni correlate
Declinazione di responsabilità
Le informazioni ed i contenuti pubblicati non costituiscono in alcun modo una sollecitazione ad investire o ad operare nei mercati finanziari. Non sono inoltre fornite o supportate da TradingView. Maggiori dettagli nelle Condizioni d'uso.