$PLTR Palentir - 4 hour - trend matrix development
A trend matrix, also known as a trend analysis matrix, is a tool used to analyze and visualize trends in data over time. It helps in identifying patterns, making forecasts, and making informed decisions based on historical data. Developing a trend matrix involves several steps:
A geometric trendline matrix is a visual representation of geometric trends in data over time. Geometric trends are characterized by a constant ratio of change rather than a constant amount of change, which is typical of linear trends.
The ratio degrades to a 0 point hub. Which often acts as a sort of cog to the movement of the dataflow.
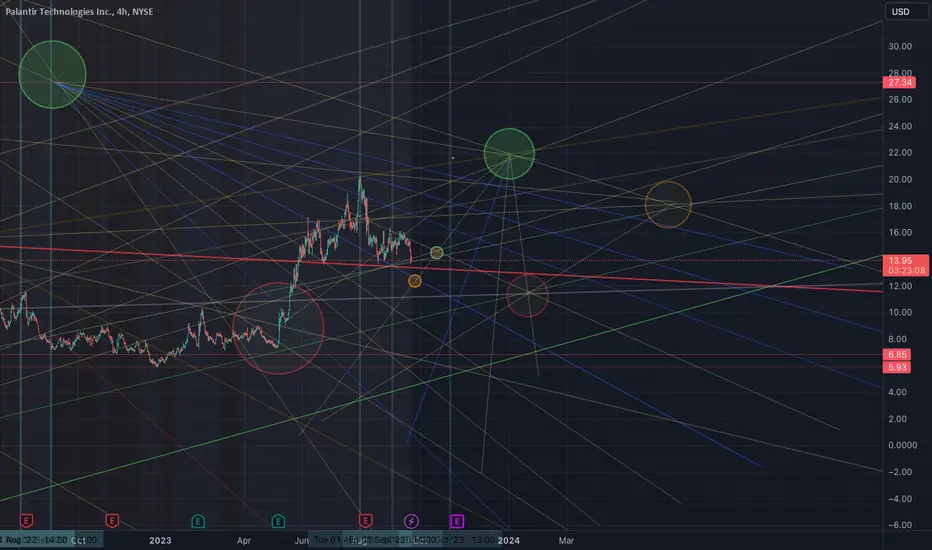
This is a 4 hour chart of Palentir
A geometric trendline matrix is a visual representation of geometric trends in data over time. Geometric trends are characterized by a constant ratio of change rather than a constant amount of change, which is typical of linear trends.
The ratio degrades to a 0 point hub. Which often acts as a sort of cog to the movement of the dataflow.
This is a 4 hour chart of Palentir
Declinazione di responsabilità
Le informazioni ed i contenuti pubblicati non costituiscono in alcun modo una sollecitazione ad investire o ad operare nei mercati finanziari. Non sono inoltre fornite o supportate da TradingView. Maggiori dettagli nelle Condizioni d'uso.
Declinazione di responsabilità
Le informazioni ed i contenuti pubblicati non costituiscono in alcun modo una sollecitazione ad investire o ad operare nei mercati finanziari. Non sono inoltre fornite o supportate da TradingView. Maggiori dettagli nelle Condizioni d'uso.