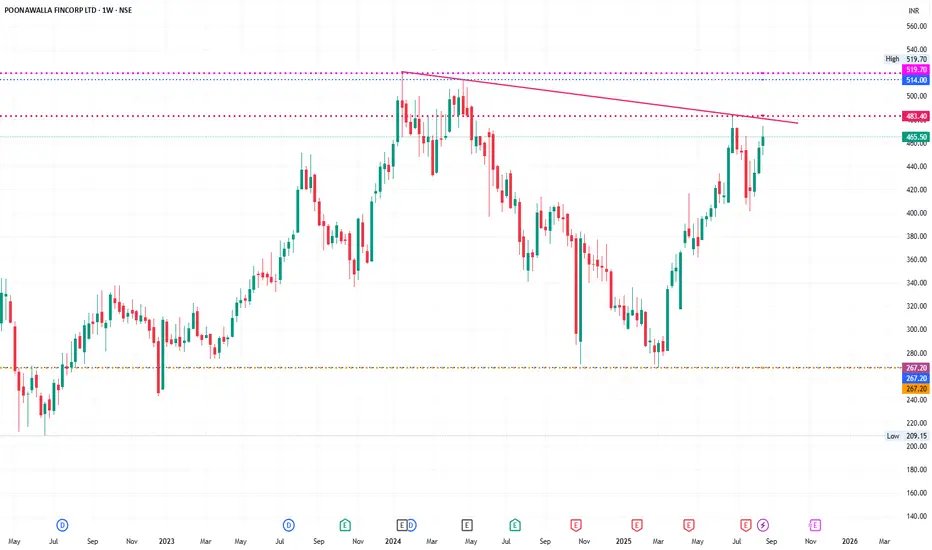
step-by-step technical analysis of Poonawalla Fincorp Ltd (Weekly Chart) the same way:
🔎 1. Chart Pattern
The stock is currently forming a Descending Triangle / Falling Trendline Resistance.
Price is approaching the trendline resistance (~₹480–485).
Breakout above ₹485–490 will confirm trend reversal.
If rejected, it may retrace back to lower supports.
🔎 2. Support & Resistance
Immediate Resistance: ₹483–490 (trendline + horizontal supply).
Next Resistance Levels: ₹514 → ₹520 (previous swing high).
Major Resistance: ₹550.
Immediate Support: ₹440 → ₹420 (recent consolidation).
Major Support Zone: ₹365 → ₹340.
Long-term Support: ₹267 (very strong base).
🔎 3. Candlestick / Price Action
The last few weekly candles show strong bullish momentum, higher highs, and higher lows.
But approaching a major supply zone (~₹480–490) → possible profit booking.
A weekly close above ₹490 with volume will confirm fresh breakout rally.
🔎 4. Indicators Perspective
RSI: Likely near 65–68 → bullish momentum but nearing overbought zone.
MACD: Positive crossover with rising histogram → bullish confirmation.
Volume: Increasing on recent up-move → accumulation happening.
Moving Averages:
Price trading above 20W & 50W EMAs → trend bullish.
If it sustains above ₹485, 200W EMA breakout likely confirms long-term uptrend.
🔎 5. Trend Outlook
Primary Trend (1–2 years): Bullish, provided stock sustains above ₹490.
Intermediate Trend (2–6 months): Neutral to bullish, watch for breakout.
Short Term (1–4 weeks): Testing resistance zone ₹480–490, may consolidate.
📌 Conclusion (Expert View)
✅ Stock is in strong uptrend but at a crucial resistance (₹483–490).
✅ Breakout above ₹490 can lead to targets ₹514 → ₹520 → ₹550.
✅ If rejected, stock can pull back to ₹440 → ₹420 zone (buying zone).
⚠️ Risk-Reward currently not very favorable until clear breakout.
👉 Strategy:
Traders: Wait for weekly close above ₹490 to enter fresh longs.
If already holding, book partial profit near ₹480–490, re-enter above ₹490 breakout.
Investors: Can accumulate on dips to ₹420–440 with SL ₹365
this is only for educational purpose not for suggestion
Trade attivo
WENT AS PER ANALYSIS READ CAREFULLY Declinazione di responsabilità
Le informazioni e le pubblicazioni non sono intese come, e non costituiscono, consulenza o raccomandazioni finanziarie, di investimento, di trading o di altro tipo fornite o approvate da TradingView. Per ulteriori informazioni, consultare i Termini di utilizzo.
Declinazione di responsabilità
Le informazioni e le pubblicazioni non sono intese come, e non costituiscono, consulenza o raccomandazioni finanziarie, di investimento, di trading o di altro tipo fornite o approvate da TradingView. Per ulteriori informazioni, consultare i Termini di utilizzo.