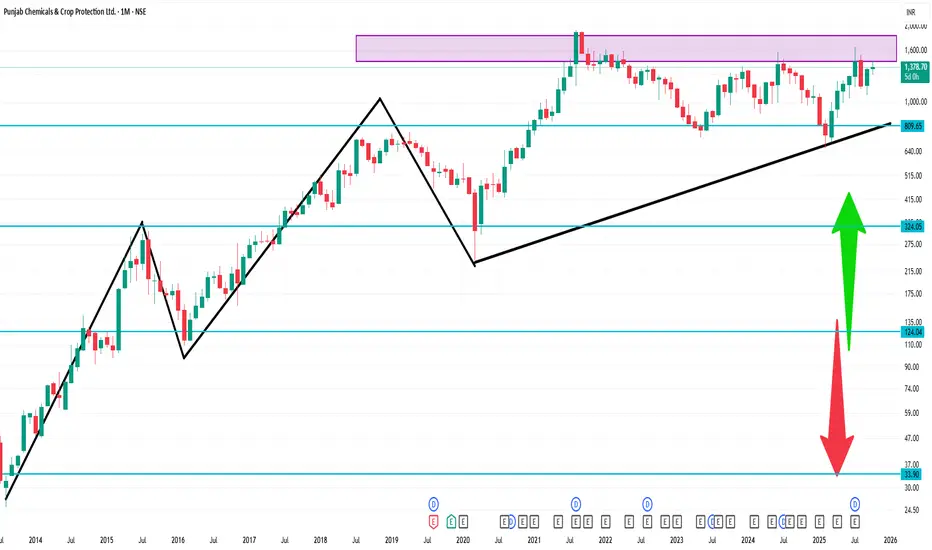
📈 1-Month Price Range (September 24 – October 24, 2025)
High: ₹1,407.50 on October 17
Low: ₹1,320.30 on October 14
Closing on October 24: ₹1,378.70
📊 Summary
Over the past month, PUNJABCHEM has experienced a decline, trading within a range of ₹1,320.30 to ₹1,407.50. Technical indicators suggest a bearish trend, with the stock trading below key moving averages and a negative MACD. However, the low RSI indicates potential for a rebound if buying interest returns.
Pubblicazioni correlate
Declinazione di responsabilità
Le informazioni ed i contenuti pubblicati non costituiscono in alcun modo una sollecitazione ad investire o ad operare nei mercati finanziari. Non sono inoltre fornite o supportate da TradingView. Maggiori dettagli nelle Condizioni d'uso.
Pubblicazioni correlate
Declinazione di responsabilità
Le informazioni ed i contenuti pubblicati non costituiscono in alcun modo una sollecitazione ad investire o ad operare nei mercati finanziari. Non sono inoltre fornite o supportate da TradingView. Maggiori dettagli nelle Condizioni d'uso.