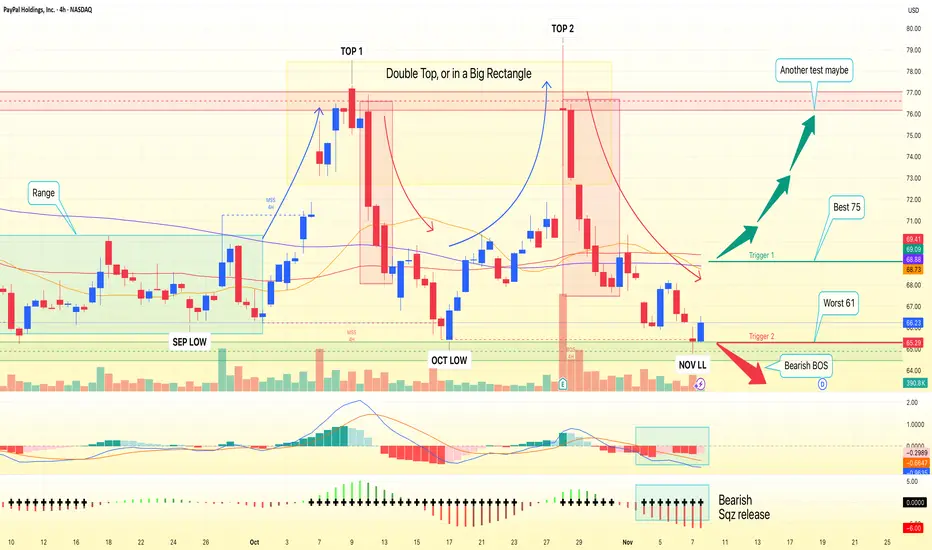
PYPL on the 1D chart remains a textbook rectangle, coiling after months of sideways trade. Price is back at the lower boundary near $65.50 with short-term momentum tilted bearish and all key MAs overhead. The MA20/60/120 are tightly clustered around $68.57–$70.63, reinforcing a heavy supply band. Volatility has contracted after October’s spike, so a decisive move from this squeeze looks close.
Primary path: neutral-to-range bias with a tactical bounce off the $65.50–$66.50 demand zone. A daily close back above the MA20 (≈$68.60) would be the first tell, while a daily close >$68.90 strengthens the case for a push into the $69.00–$70.50 cluster and a retest of $75.00. A sustained break and hold above $75.00 would transition the structure toward a fresh up-leg.
Alternative: failure at support. A decisive daily close <$65.20 would confirm a range breakdown and open $61.00. For positioning, keep the line in the sand tight: long ideas are invalid below $64.70; short ideas lose edge above $79.50. Until a break, respect the range—fade extremes and be disciplined with size, as volume on any breakout should be the confirmation cue.
This is a study, not financial advice. Manage risk and invalidations
Nota
🎁 Please hit the like button and🎁 Leave a comment to support my work!
follow my X 👉 x.com/bbqgio
🔥 level up your Stock, FX, & Crypto: VIP access to AI technical analysis and pro market insights at TradeOS 👉
ai.tradeos.xyz/?utm_source=tvbg
🔥 level up your Stock, FX, & Crypto: VIP access to AI technical analysis and pro market insights at TradeOS 👉
ai.tradeos.xyz/?utm_source=tvbg
Declinazione di responsabilità
Le informazioni ed i contenuti pubblicati non costituiscono in alcun modo una sollecitazione ad investire o ad operare nei mercati finanziari. Non sono inoltre fornite o supportate da TradingView. Maggiori dettagli nelle Condizioni d'uso.