Holy Cow! Took me forever to do this chart!!!!
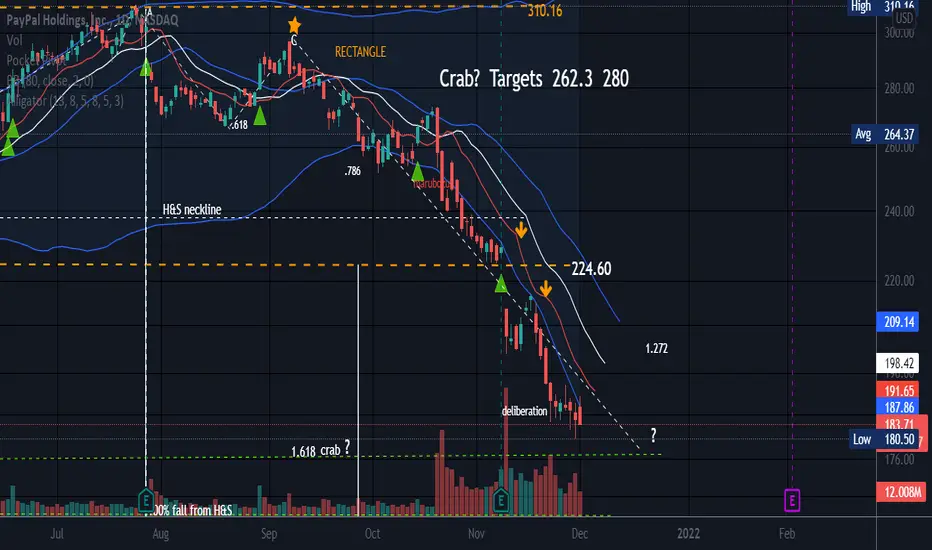
PYPL fell out of a rectangle and has hit targets 1, plus a few dollars more, to the downside. It is hard to guess with market volatility, whether this will bottom at 180.50 for now which is very close to the 1.618 of the possible Crab that could be forming. If it actually hits the 1.68, it would be a few dollars below 180.50 at 177ish. Price does not always hit the exact place the fib levels fall for any pattern, including harmonic patterns but is nice when price hits it close. It is not a perfect world though. Sometimes folks look for an area of confluence close by the fib level. The bottom before 180.50 is 174.81. If 180.50 does not hold, which it may not, I always look to the next support level or pattern targets levels. I am waiting and watching this closely and setting alerts a long the way down.
There was also an ugly top and the white line is a guesstimate of where the ugly top could go. So far PYPL has broken the bottom trendline of a Rectangle and had also formed a head and shoulders top/ugly top and broken down through the neckline of an ugly top.
Deliberation is a candle pattern where either the red candles get smaller and smaller showing less selling pressure, or green candles at the top get smaller and smaller at the top showing less buying pressure.
If the market decides to hail again, this may likely go even lower. There is a lot of resistance overhead and folks who are stuck up there will sell on any and every rally. To reach targets 2 (in small print above the rectangle) for the possible crab pattern, price would have to break the resistance of the top trendline of that rectangle. I know this chart is probably confusing and apologize as i prefer keeping it simple and clutter free )O: William's Alligator indicates a downtrend still in progress.
No recommendation.
Before Buying Or Selling, Ask Yourself Three Questions..."
- Does hitting my hand with a hammer help?
- What was I thinking?
- How do you get a tan with a flashlight?
(o:
Nota
Price is below the lower Bollinger band set on an 80 SMA.Nota
Price does not always rise fall to a 100% target of a pattern and can hit a lesser fib level or unfortunately, an extension of the 100% mark. It is just a way to get an idea of where price may go.Declinazione di responsabilità
Le informazioni ed i contenuti pubblicati non costituiscono in alcun modo una sollecitazione ad investire o ad operare nei mercati finanziari. Non sono inoltre fornite o supportate da TradingView. Maggiori dettagli nelle Condizioni d'uso.
Declinazione di responsabilità
Le informazioni ed i contenuti pubblicati non costituiscono in alcun modo una sollecitazione ad investire o ad operare nei mercati finanziari. Non sono inoltre fornite o supportate da TradingView. Maggiori dettagli nelle Condizioni d'uso.