🔎 Chart Context
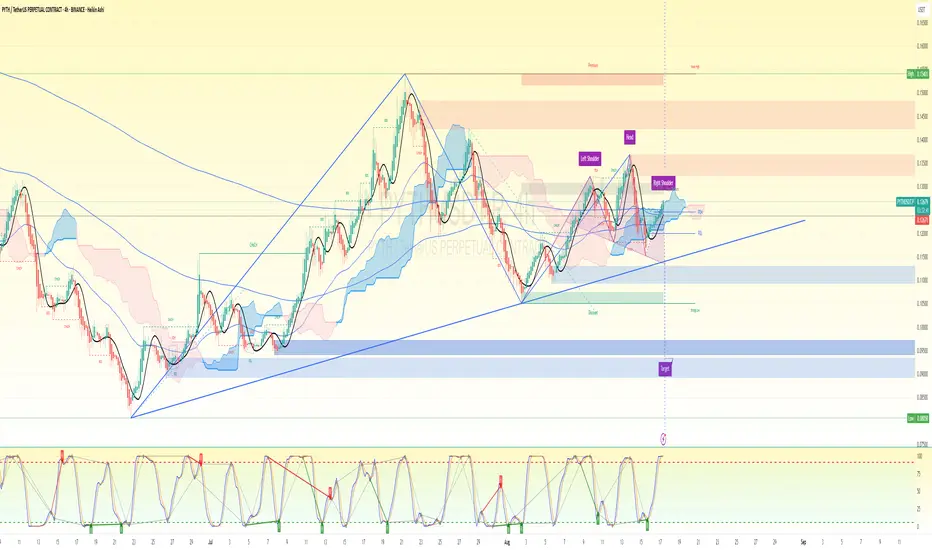
Pattern: A clear Head & Shoulders (H&S) structure has formed. Price is testing the neckline area (~0.126–0.128).
Indicators:
Stochastic RSI is pushing up from oversold → suggesting temporary relief rally.
Price is still inside/near the cloud resistance zone (bearish bias).
Target Zone: Marked at 0.090–0.095, aligning with the measured H&S breakdown.
📍 Precise Sniper Setup
Bias: Bearish (most probable continuation setup).
Entry (Short):
Aggressive: 0.1265 – 0.1280 (current price + neckline retest zone).
Conservative: Wait for a 4h close below 0.1230 (clean neckline break confirmation).
Stop-Loss (SL):
Above Right Shoulder high ~0.1315.
Safer SL: 0.1330 (above liquidity sweep zone).
Take-Profit (TP):
TP1: 0.1150 (near PDL / liquidity pocket).
TP2: 0.1050 (discount zone).
TP3 (Full H&S target): 0.090–0.095 range (your chart’s marked target).
⏳ Estimated Timeframe
If neckline breaks cleanly, TP1–TP2 can be reached in 2–4 days.
Full H&S target (~0.090) could take 5–10 days depending on momentum/volume.
✅ Summary (No bias):
Most probable trade = short from neckline zone (0.126–0.128) with SL above 0.1330 and targets down to 0.095.
If bulls reclaim and hold above 0.1330, the bearish setup is invalidated and shift to neutral → potential upside squeeze into 0.137–0.140.
Trade chiuso: obiettivo raggiunto
Target 1 achieved. Nota
TP 2 LoadingDeclinazione di responsabilità
Le informazioni ed i contenuti pubblicati non costituiscono in alcun modo una sollecitazione ad investire o ad operare nei mercati finanziari. Non sono inoltre fornite o supportate da TradingView. Maggiori dettagli nelle Condizioni d'uso.
Declinazione di responsabilità
Le informazioni ed i contenuti pubblicati non costituiscono in alcun modo una sollecitazione ad investire o ad operare nei mercati finanziari. Non sono inoltre fornite o supportate da TradingView. Maggiori dettagli nelle Condizioni d'uso.