The Thanksgiving bounce was real & technically healthy with a sharp V-reversal off ~$585
Both a pullback or breakout are technically reasonable

The most realistic path is a slow grind into $630-$633 early this week & after FOMC, the market chooses its path
A “bounce into FOMC & then fade” base case is completely supported by the charts,
but it’s not the only valid outcome

A breakout remains technically possible if $637 is reclaimed with volume
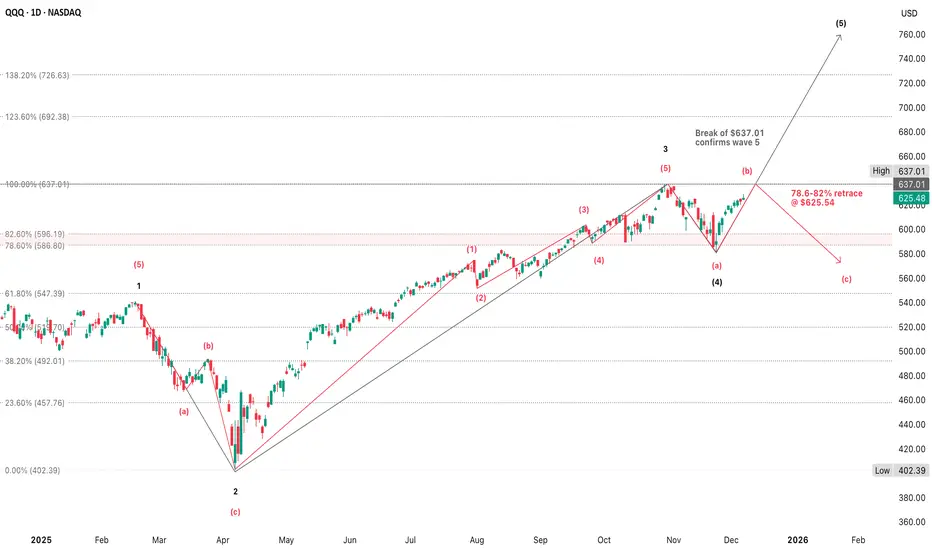
Wave 5 & Wave b often look similar until one key level is broken or held & right now, price is where both counts remain technically valid & that’s why I feel at a loss - it's ambiguous by nature, but there are precise levels that resolve the ambiguity
1. Price must break above the prior high at $637.01 with no exceptions
2. Wave 5 should show expanding candles, improving breadth & stronger volume on the
push through resistance bands
1. If price rejects at resistance, wave b is confirmed & wave 5 is invalidated
2. If price closes above $637, then wave 5 is confirmed, period
3. If price rejects $630-$637 & breaks below $612, then the wave b path is confirmed
The bounce up from wave a low looks much more like a wave b correction than a wave 5 start given the retracement depth (~78.6%) fits wave b perfectly, declining volume, stretched oscillators without trend confirmation & price pinned under major resistance
Structurally, the chart is sound & doesn't violate any hard Elliott rules
The wave c target around $572 is reasonable if the correction continues
- Buyers regained key MAs (20d & 50d), oscillators turned upward & price broke out of the panic low without resistance
- Last week’s action built a tight coil under a clear ceiling & this type of setup often resolves after a catalyst (FOMC)
- QQQ is at a true inflection point - not obviously topping, not clearly breaking out
Both a pullback or breakout are technically reasonable
- A pullback is possible given stretched momentum, thinning volume, clear resistance $631-$637, many components are strong, but not surging & other short-term exhaustion signals which makes a risk of fade technically credible
- A breakout is still possible because the trend structure is intact, buyers defended every dip for 2 weeks, short-term AVWAPs are rising under price (support) & no reversal signals so the market tends to drift upward into events
The most realistic path is a slow grind into $630-$633 early this week & after FOMC, the market chooses its path
- If buyers don’t have conviction, then a pullback toward $612 to $605
- If buyers get a catalyst, then a breakout above $637
A “bounce into FOMC & then fade” base case is completely supported by the charts,
but it’s not the only valid outcome
A breakout remains technically possible if $637 is reclaimed with volume
- QQQ’s Thanksgiving rally carried into last week’s consolidation & the index is now poised at resistance in a balanced, technically neutral state so it can push higher into the $630-$633 early in the week, but the real move (pullback or breakout) will be decided after FOMC
Wave 5 & Wave b often look similar until one key level is broken or held & right now, price is where both counts remain technically valid & that’s why I feel at a loss - it's ambiguous by nature, but there are precise levels that resolve the ambiguity
1. Price must break above the prior high at $637.01 with no exceptions
- Wave 5 must make a higher high relative to wave 3
2. Wave 5 should show expanding candles, improving breadth & stronger volume on the
push through resistance bands
- Right now the move out of wave a is corrective-looking & wave 5 often starts with corrective back-testing; however, it has the look of an a–b–c upward correction, not a start of a new leg higher & this is a yellow flag for the bull case
1. If price rejects at resistance, wave b is confirmed & wave 5 is invalidated
- Price often stops exactly at the 78.6-82% retrace, which is common for wave b peaks
- Price should fail below $632-$637, then break $600-$605 & possibly accelerate lower to $570
2. If price closes above $637, then wave 5 is confirmed, period
3. If price rejects $630-$637 & breaks below $612, then the wave b path is confirmed
- This is the most important support on the chart
- Break $612 & the bounce was corrective so wave c is next
The bounce up from wave a low looks much more like a wave b correction than a wave 5 start given the retracement depth (~78.6%) fits wave b perfectly, declining volume, stretched oscillators without trend confirmation & price pinned under major resistance
- Wave 5 usually doesn't start with weak volume & overlapping candles, but wave b rallies often do
- We don't confirm the wave b top until the market breaks support
Structurally, the chart is sound & doesn't violate any hard Elliott rules
- A wave b often retraces 61.8-78.6%, or sometimes 100% of wave a
- The current rally is sitting just below the 78.6-82% ($630-$632) & may even tag $637 if the market pushes into the event/catalyst
- Wave c unfolds in 5 clean subwaves, often in a move parallel to wave a & usually lands near the 61.8% retrace of the prior impulse
- A realistic target is $560-$575
The wave c target around $572 is reasonable if the correction continues
- 0.618 × wave a (~32 points)
- 1 × wave a (most common, ~52 points)
- 1.618 × wave a (during strong, sharp corrections, ~84 points)
- $572 is between the 0.618 & 1 projections for wave c
- Lands almost perfectly on the 50% retracement of the entire wave 3 advance
I am not a licensed professional & these posts are for informational purposes only, not financial advice.
Declinazione di responsabilità
Le informazioni e le pubblicazioni non sono intese come, e non costituiscono, consulenza o raccomandazioni finanziarie, di investimento, di trading o di altro tipo fornite o approvate da TradingView. Per ulteriori informazioni, consultare i Termini di utilizzo.