Each stock is in a primary uptrend, but with slightly different phases of momentum - you’re seeing a bit of divergence among the “QQQ generals,' which is important
AAPL
MSFT
NVDA
RSI
Stochastic
MACD
Volume Profile
AAPL
MSFT
NVDA
Consolidation phase likely early next week, with NVDA likely to resume leading QQQ higher if $200-$202 holds
Friday's small real body, upper wick - suggests sellers faded late-day strength, but not heavy distribution
Holding above $620 keeps the bull case fully intact & a breakout above $640 opens potential for $655-$665 targets (measured move from flag)
AAPL, AMZN, META, MSFT & TSLA have already reported strong earnings, so now semiconductors & AI names like AMD & PLTR become the next catalysts
AAPL
- Grinding higher, above 50d MA & within upper Bollinger band
- Still trending, but upper wicks = supply around $275-$277; likely digestion area
MSFT
- Pullback from $555 to ~$520 after new highs
- Healthy retrace toward 50d MA so watch for higher low near $510-$515
NVDA
- Leading - broke out above prior $195 resistance, holding gains
- Most bullish of the 3; small-bodied candle near top = consolidation before next leg
- All 3 show small bodies with upper wicks, meaning buyers pushed early, but met resistance - a pause, not yet reversal
- No major bearish engulfing or heavy volume sell candle which suggests profit-taking, not panic
RSI
- AAPL ~62 - mid-uptrend, not overbought
- MSFT ~56 - cooling, but healthy
- NVDA ~56 - steady strength
- RSI readings between 55-65 indicate trend continuation (no exhaustion yet)
Stochastic
- AAPL/NVDA are curling up - supports continuation
- MSFT dipped, possibly a near-term bottom forming
- Watch for cross-ups below 20 for next entry cues
MACD
- AAPL is still positive, slight flattening = momentum pause
- MSFT is bearish crossover forming (watch histogram near zero)
- NVDA is bullish crossover confirmed - strongest setup technically
Volume Profile
- AAPL is slight uptick but not blow-off
- MSFT volume surge on red candle - likely earnings reaction fading
- NVDA high participation, but stable = institutions still active
AAPL
- Above $270 = breakout continuation
- Bullish consolidation
- Watch for breakout >$277 or retest
- ~$258 support
MSFT
- Needs hold >$515 to avoid deeper pullback
- Neutral–Bullish (short-term digestion)
- Accumulate on $510 retest if RSI holds >45
NVDA
- Above $200 breakout zone; $212 = extension target
- Bullish
- Buy-the-dip setup above $188-$190 (AVWAP support)
Consolidation phase likely early next week, with NVDA likely to resume leading QQQ higher if $200-$202 holds
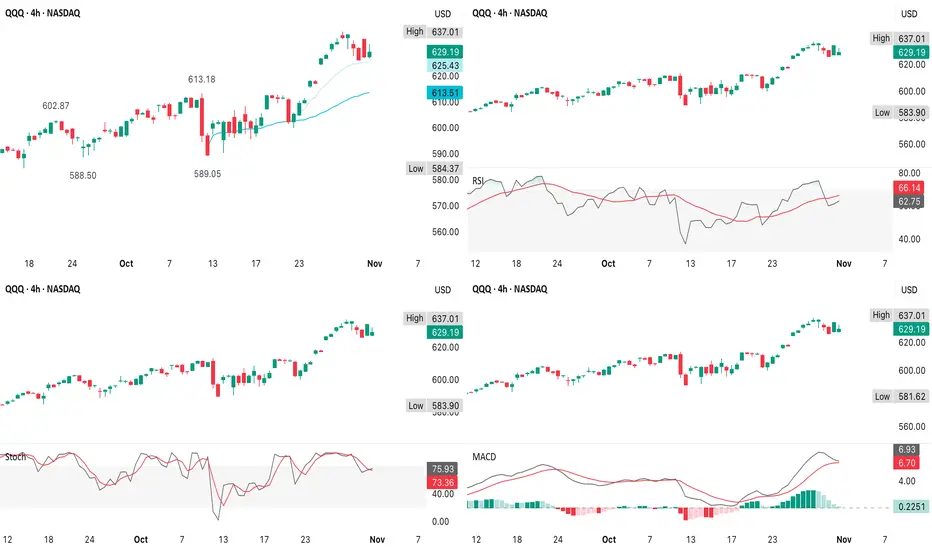
- QQQ remains in a strong uptrend, trading above the 50d MA & well above the 200d MA
- After an earnings rally (AAPL, AMZN, META) it pulled back slightly, but hasn’t broken support - meaning the trend is intact, but stretched
- The chart resembles a bullish pennant/flag forming just below the prior high (~$637-$640)
- Tight consolidation after a vertical rally = continuation potential
Friday's small real body, upper wick - suggests sellers faded late-day strength, but not heavy distribution
- Strong breakout candles with solid volume confirm institutional accumulation
- So far, more of a rest bar than reversal bar
- Healthy momentum - RSI could cool near 60 without breaking trend
- MACD shows momentum slowing, not reversing
- Watch for histogram tick-up after 2-3 quiet days (potential signal for next leg higher)
- Stochastic curling down from overbought (80-90)
- Short-term pause likely, but still bullish mid-term unless it dips below 40
- Volume was high during breakout (post-earnings), but tapered during the pullback - classic bullish pattern
- No sign of distribution selling yet
Holding above $620 keeps the bull case fully intact & a breakout above $640 opens potential for $655-$665 targets (measured move from flag)
- AAPL neutral-bullish = confirming broad tech strength
- NVDA leading = risk-on sentiment still strong
- MSFT softening = brief digestion phase; not yet dragging the index
- VIX near cycle lows, TNX (yields) easing - macro tailwinds for growth stocks
AAPL, AMZN, META, MSFT & TSLA have already reported strong earnings, so now semiconductors & AI names like AMD & PLTR become the next catalysts
- With NVDA earnings not until 19 November, AMD’s report Monday night effectively becomes a read-through for the AI/semiconductor complex, which heavily affects QQQ
- Best-case for bulls is a strong AMD report = renewed AI momentum - QQQ clears $640 resistance
I am not a licensed professional & these posts are for informational purposes only, not financial advice
Declinazione di responsabilità
Le informazioni ed i contenuti pubblicati non costituiscono in alcun modo una sollecitazione ad investire o ad operare nei mercati finanziari. Non sono inoltre fornite o supportate da TradingView. Maggiori dettagli nelle Condizioni d'uso.