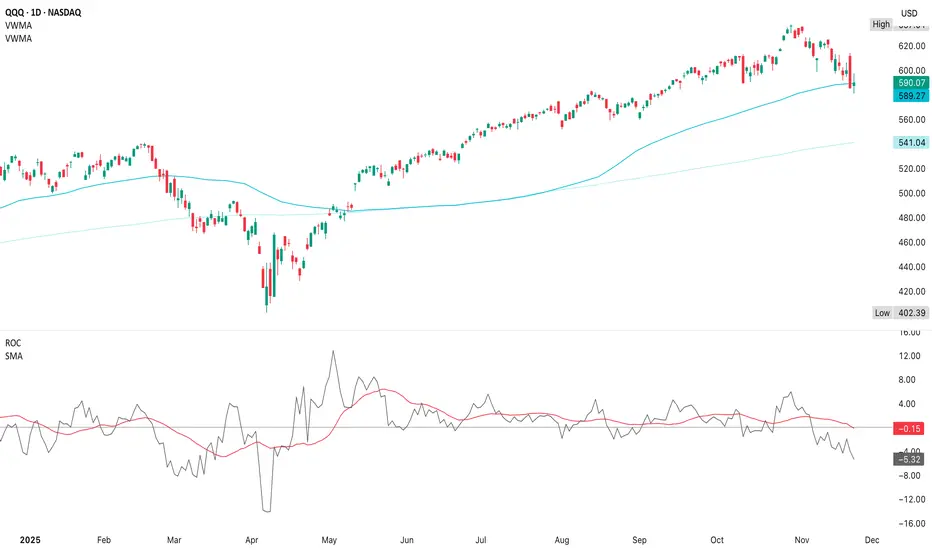
VWMA is like an EMA, but weighted by volume, so it tells you what price the heavy money is actually paying & it exposes trend shifts earlier than simple moving averages
This aligns with the multi-timeframe weakness in stochastics rolling over on daily & 4H & RSI making lower highs

ROC is trending below its signal line which signals that this isn’t just a dip, but that momentum is deteriorating across multiple layers
There are only 2 reasons for VROC to spike this hard (unusual ahead of Thanksgiving) & spikes above 100% only occur near major turning points, both tops & bottoms

This is the opposite of a bottoming structure
Looking at earlier timeframes, initial support is $586-$589
Given VWMA downtrend & ROC weakness, the path of least resistance is still down to the $573-$576 or $560 area unless a catalyst interrupts the selling

Thanksgiving week usually has lighter volume that contribute to false moves & NFP data the following week is a a major event into the December FOMC, so expect a weak bounce ($598-$605) in the next 3-5 trading days with a pullback lower into early/mid December
Until ROC flattens, ROC offers a bullish divergence, price reclaims 20d VWMA & stoch/RSI turn up on the daily, QQQ is still in the middle of a corrective leg down; instead of a real, tradable reversal
- The 20d VWMA is curling down which shows that the short-term trend has firmly turned bearish
- This downturn began well before the breakdown
- The 50d VWMA is flattening, slightly bending down so the medium-term trend is now losing momentum
- When 20d crosses below 50d VWMA (if it happens), that’s a trend-change confirmation
This aligns with the multi-timeframe weakness in stochastics rolling over on daily & 4H & RSI making lower highs
ROC is trending below its signal line which signals that this isn’t just a dip, but that momentum is deteriorating across multiple layers
- ROC is extremely useful for measuring acceleration; rather than, direction
- ROC has been trending under the signal line for about 2 weeks & is now below zero, indicating negative momentum
- No bullish divergence appears yet (price lows not rising vs ROC lows rising)
- The ROC signal line is sloping down which signals sustained weakness
There are only 2 reasons for VROC to spike this hard (unusual ahead of Thanksgiving) & spikes above 100% only occur near major turning points, both tops & bottoms
- Capitulation into a low
- Institutional rotation before another leg lower
This is the opposite of a bottoming structure
- Current ROC behavior matches early-cycle pullback phases from February 2020, September 2021, April 2022 & March 2024
- Each of these periods saw a continued drift lower, lower highs on oscillators & price returning to mid-range support levels
Looking at earlier timeframes, initial support is $586-$589
- $573-$576 is highly probable if the oversold bounce fails
- $558-$563 is weekly support & $540-$545 is less likely, but possible in a deeper correction (50wk MA)
Given VWMA downtrend & ROC weakness, the path of least resistance is still down to the $573-$576 or $560 area unless a catalyst interrupts the selling
- Historically, when ROC breaks below zero & VWMA is rolling over, the pullback usually extends 2-4 weeks
- Price tends to form a lower low or retest the first low before recovering
- Bounce attempts during this period are weak (exactly what we saw this week)
Thanksgiving week usually has lighter volume that contribute to false moves & NFP data the following week is a a major event into the December FOMC, so expect a weak bounce ($598-$605) in the next 3-5 trading days with a pullback lower into early/mid December
- The true reversal likely only after a vol spike & ROC divergence
- This is not yet bottoming behavior, momentum is declining, the short-term bounce attempts are corrective, not impulsive, so the next logical destination remains $573-$576 & then $560
Price may push higher to $605-$612 which means we see a sharper sell-off in December
Until ROC flattens, ROC offers a bullish divergence, price reclaims 20d VWMA & stoch/RSI turn up on the daily, QQQ is still in the middle of a corrective leg down; instead of a real, tradable reversal
I am not a licensed professional & these posts are for informational purposes only, not financial advice
Declinazione di responsabilità
Le informazioni e le pubblicazioni non sono intese come, e non costituiscono, consulenza o raccomandazioni finanziarie, di investimento, di trading o di altro tipo fornite o approvate da TradingView. Per ulteriori informazioni, consultare i Termini di utilizzo.