## 📊 TradingView – Radico Khaitan Ltd. (RADICO)
**1. Fundamental Snapshot**
* **Q1 FY26 Performance (YoY growth):**
* Sales: ₹1,506 Cr (+33%)
* EBITDA: ₹232 Cr (+56%)
* Net Profit: ₹133 Cr (+82%)
* EPS: ₹9.96 vs ₹5.71 last year (+74%)
* **Valuation:**
Market Cap \~₹36,578 Cr, trading at a high P/E of \~89.8, which reflects premium valuations often given to consumer staples and brand‑driven liquor companies.
* **Takeaway:** The company delivered strong double‑digit top‑line and bottom‑line growth, highlighting demand resilience and margin expansion despite a competitive environment.
---
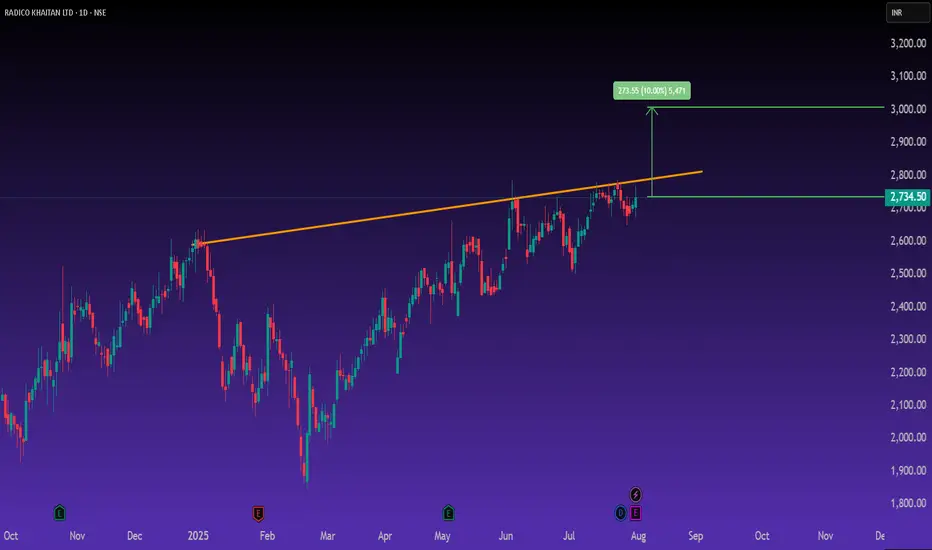
**2. Technical View**
* **Trend:** The stock has been consolidating within a rising channel for months, now testing the breakout zone near ₹2,730–2,750.
* **Breakout Signal:** A sustained move above this level could trigger a fresh leg up towards ₹3,000 (approx. 10% upside).
* **Support Zones:** ₹2,600 remains key support; below that, momentum may weaken.
* **Resistance Zones:** Immediate resistance \~₹2,900–3,000.
**Chart Tone:** The ascending trendline breakout attempt shows buyers accumulating at higher levels. If volume confirms, a clear bullish continuation pattern emerges.
---
**3. Trading Plan (Momentum View)**
* **Entry:** On breakout above ₹2,750–2,770
* **Target:** ₹3,000+
* **Stop Loss:** ₹2,600
---
### ✅ Disclaimer
*This analysis is for educational purposes only. It is not investment advice. Please DYOR and consult a SEBI‑registered advisor before making any trading or investment decision. I am not SEBI registered.*
**1. Fundamental Snapshot**
* **Q1 FY26 Performance (YoY growth):**
* Sales: ₹1,506 Cr (+33%)
* EBITDA: ₹232 Cr (+56%)
* Net Profit: ₹133 Cr (+82%)
* EPS: ₹9.96 vs ₹5.71 last year (+74%)
* **Valuation:**
Market Cap \~₹36,578 Cr, trading at a high P/E of \~89.8, which reflects premium valuations often given to consumer staples and brand‑driven liquor companies.
* **Takeaway:** The company delivered strong double‑digit top‑line and bottom‑line growth, highlighting demand resilience and margin expansion despite a competitive environment.
---
**2. Technical View**
* **Trend:** The stock has been consolidating within a rising channel for months, now testing the breakout zone near ₹2,730–2,750.
* **Breakout Signal:** A sustained move above this level could trigger a fresh leg up towards ₹3,000 (approx. 10% upside).
* **Support Zones:** ₹2,600 remains key support; below that, momentum may weaken.
* **Resistance Zones:** Immediate resistance \~₹2,900–3,000.
**Chart Tone:** The ascending trendline breakout attempt shows buyers accumulating at higher levels. If volume confirms, a clear bullish continuation pattern emerges.
---
**3. Trading Plan (Momentum View)**
* **Entry:** On breakout above ₹2,750–2,770
* **Target:** ₹3,000+
* **Stop Loss:** ₹2,600
---
### ✅ Disclaimer
*This analysis is for educational purposes only. It is not investment advice. Please DYOR and consult a SEBI‑registered advisor before making any trading or investment decision. I am not SEBI registered.*
Declinazione di responsabilità
Le informazioni ed i contenuti pubblicati non costituiscono in alcun modo una sollecitazione ad investire o ad operare nei mercati finanziari. Non sono inoltre fornite o supportate da TradingView. Maggiori dettagli nelle Condizioni d'uso.
Declinazione di responsabilità
Le informazioni ed i contenuti pubblicati non costituiscono in alcun modo una sollecitazione ad investire o ad operare nei mercati finanziari. Non sono inoltre fornite o supportate da TradingView. Maggiori dettagli nelle Condizioni d'uso.