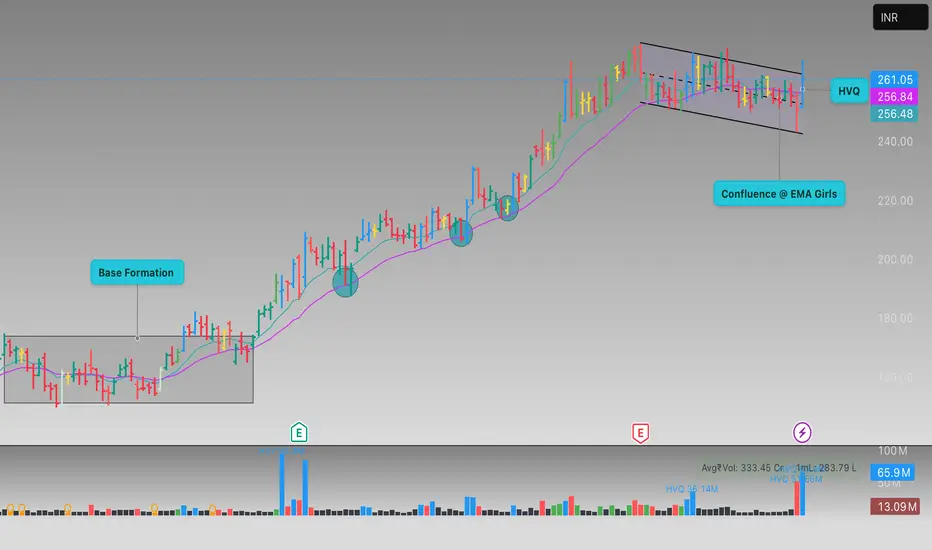
This TradingView chart displays the daily candlestick price movement of RBLBANK in INR, highlighting important technical patterns and zones. The chart features a “Base Formation” region, an upward breakout followed by steady bullish momentum, and a consolidation phase (flag channel) at higher levels. Key technical elements include two Exponential Moving Averages (EMAs), support and resistance zones, and high volume clusters (HVQ) indicating significant trading activity. Annotations such as “Confluence @ EMA” and volume bars further assist in identifying potential entry and exit points for traders.
Declinazione di responsabilità
Le informazioni ed i contenuti pubblicati non costituiscono in alcun modo una sollecitazione ad investire o ad operare nei mercati finanziari. Non sono inoltre fornite o supportate da TradingView. Maggiori dettagli nelle Condizioni d'uso.
Declinazione di responsabilità
Le informazioni ed i contenuti pubblicati non costituiscono in alcun modo una sollecitazione ad investire o ad operare nei mercati finanziari. Non sono inoltre fornite o supportate da TradingView. Maggiori dettagli nelle Condizioni d'uso.