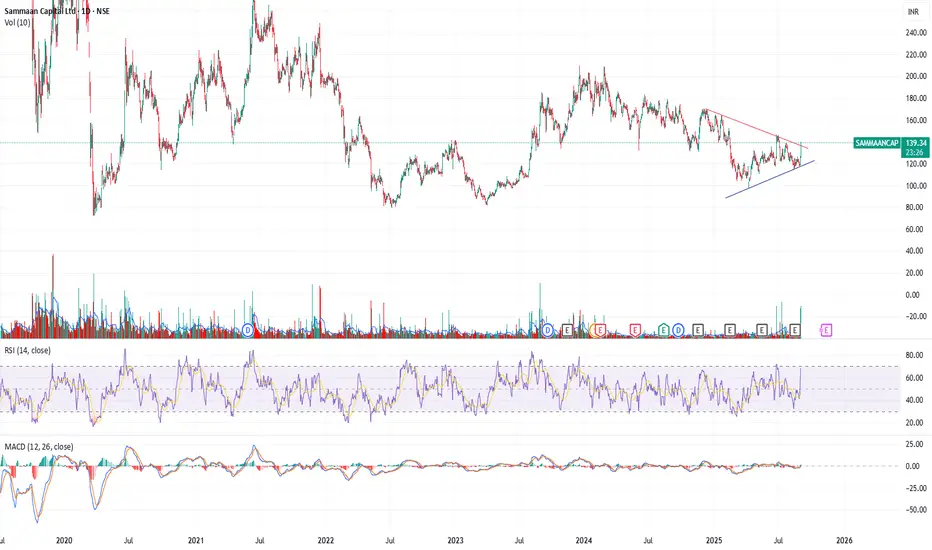
The chart for SAMMAANCAP (NSE) is signaling a bullish breakout from a symmetrical triangle or wedge pattern, propelled by a sharp jump in price (+10.66%) and a substantial surge in trading volume, which often marks the start of upward momentum. Technical indicators reinforce this bullishness: the RSI is near 68, approaching overbought territory but not yet extreme, and the MACD shows a positive crossover with growing histogram strength, both pointing to continued upside potential. With price now above short-term moving averages (EMA 9, 21, 50), and volume confirming the breakout, a fresh long position can be considered above ₹138 with a stop loss around ₹126, and first targets near ₹150–₹160 where previous resistance lie
Declinazione di responsabilità
Le informazioni ed i contenuti pubblicati non costituiscono in alcun modo una sollecitazione ad investire o ad operare nei mercati finanziari. Non sono inoltre fornite o supportate da TradingView. Maggiori dettagli nelle Condizioni d'uso.
Declinazione di responsabilità
Le informazioni ed i contenuti pubblicati non costituiscono in alcun modo una sollecitazione ad investire o ad operare nei mercati finanziari. Non sono inoltre fornite o supportate da TradingView. Maggiori dettagli nelle Condizioni d'uso.