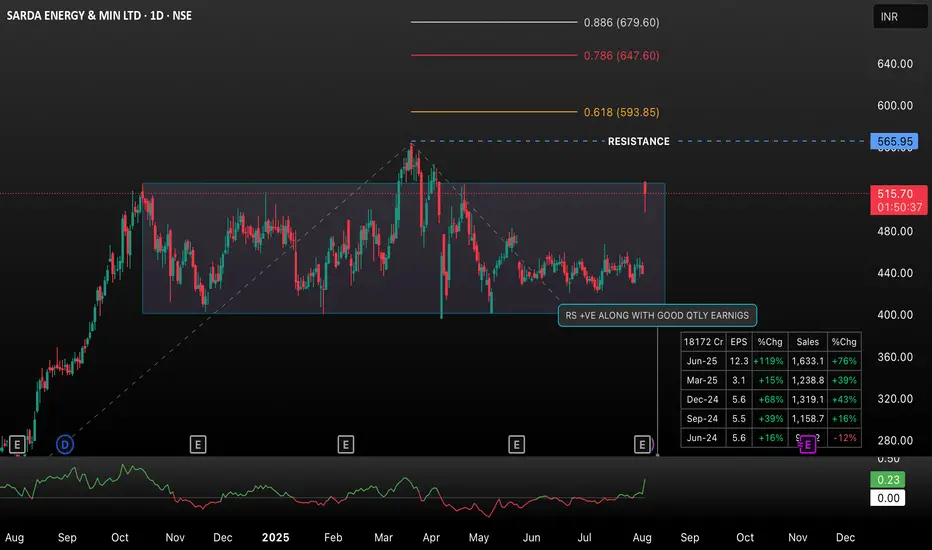
Sarda Energy (NSE: SARDAE) has broken out of its multi-month consolidation zone (~400–515) with a significant surge, gaining 17.57% on the day. Key Fibonacci retracement levels are plotted, with 0.618 (593.85), 0.786 (647.60), and 0.886 (679.60) acting as potential resistance zones post-breakout. The move is supported by strong volume and improving fundamentals, as seen in the positive EPS and sales changes. Watch for sustained price action above the previous range and reactions at the highlighted Fibonacci levels for potential targets and stop-loss adjustments.
This title and description should help others quickly understand the context, technical significance, and what to watch for next in this setup.
This title and description should help others quickly understand the context, technical significance, and what to watch for next in this setup.
Trade attivo
TRY TO LEARN HOW THINGS IN STOCK MARKET WORKS• The price moved up further to 581.75 INR, registering a 7.67% intraday gain.
• The breakout was confirmed and sustained, with the price crossing above the 0.618 Fibonacci retracement (593.85 INR), which acts as a major resistance.
• The price is approaching the resistance zone (marked near 581.75–593.85 INR).
• Volume surged significantly, confirming that the breakout has institutional support.
2. Technical Indicators
• Fibonacci retracement levels drawn from the previous swing high to swing low indicate next resistance levels at 593.85 (0.618), 647.60 (0.786), and 679.60 (0.886).
• In the second chart, Fibonacci targets beyond 0.618 are mapped up to 913.90 (1.618 extension).
• Relative Strength (RS) is shown as positive, with a note about good quarterly earnings, supporting the breakout’s strength.
3. Volume
• Volume has increased sharply on the breakout, which generally indicates a real move rather than a false breakout.
Update and Outlook for Future Trading
Bullish Momentum Confirmed:
• The successful close above the long sideways range and follow-up buying confirm a breakout.
• Sustained high volume and positive earnings data add conviction.
Next Target Levels:
• Immediate resistance is seen around 593.85 INR (0.618 Fibonacci). A breakout above this could target 647.60 INR (0.786), then 679.60 INR (0.886), and higher Fibonacci extensions (758, 803, 849, 914 INR) if momentum continues.
Support Levels:
• The breakout zone (520–540 INR) will act as the first crucial support. A retest of this zone (pullback) could offer a secondary entry with lower risk.
• A failure to sustain above 540 INR would signal caution.
Risk Management:
• Due to the sharp rally, consider trailing stop-losses below support or 8–10% below the entry to protect against reversals.
• Watch for any reversal signals if price fails to cross 593.85 INR convincingly.
Actionable Trading Plan:
• Existing positions: Hold with tight trailing stops.
• New positions: Buy on dips/retests above the 520–540 INR zone, targeting the next Fibonacci levels.
• Exit plan: Watch price action near 593–600 INR. Book partial profits if momentum stalls; hold the rest for targets beyond 650 INR.
Declinazione di responsabilità
Le informazioni e le pubblicazioni non sono intese come, e non costituiscono, consulenza o raccomandazioni finanziarie, di investimento, di trading o di altro tipo fornite o approvate da TradingView. Per ulteriori informazioni, consultare i Termini di utilizzo.
Declinazione di responsabilità
Le informazioni e le pubblicazioni non sono intese come, e non costituiscono, consulenza o raccomandazioni finanziarie, di investimento, di trading o di altro tipo fornite o approvate da TradingView. Per ulteriori informazioni, consultare i Termini di utilizzo.