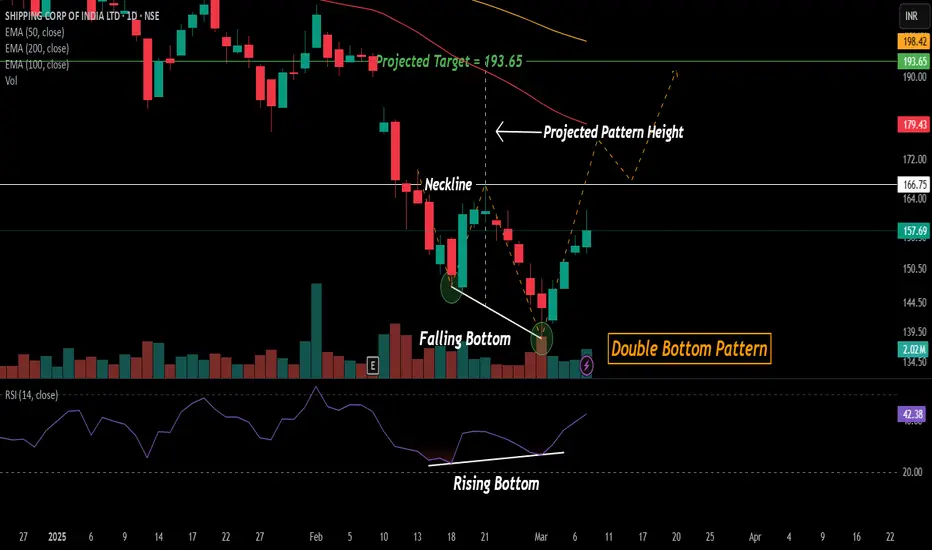
📊 Chart Pattern:
A Double Bottom pattern has been identified on the daily chart of Shipping Corporation of India (SCI), indicating a potential trend reversal from the recent downtrend.
🔍 Key Observations:
Falling Bottom & Rising Bottom:
The first bottom formed at a lower level, followed by a second bottom at a slightly higher level, aligning with bullish RSI divergence (indicating possible strength in the price action).
Neckline Breakout Level:
The neckline of the pattern is around ₹169-172, which serves as the critical resistance level. A breakout above this level could confirm a bullish move.
Projected Target:
The pattern height projection suggests a potential target of ₹193.65 upon a successful breakout.
EMA Resistance Levels:
The price is currently below the 50 EMA (₹198.76), 100 EMA (₹212.83), and 200 EMA (₹218.62). A breakout above these levels would further strengthen the bullish outlook.
RSI Recovery:
The Relative Strength Index (RSI) is recovering from oversold levels, currently at 42.38, suggesting that bullish momentum is slowly building.
📈 Trading Plan:
A confirmed breakout above ₹169-172 with strong volume could indicate a further bullish rally toward the ₹193-195 zone.
Stop-loss: Below the second bottom level to manage risk.
Watch EMA Levels: The stock needs to sustain above key moving averages to continue upward momentum.
Disclaimer: Consider my analysis for educational purposes only.
Before entering any trade:
1️⃣ Educate Yourself – Understand market dynamics and technical patterns.
2️⃣ Do Your Own Research & Analysis – Never rely solely on external opinions.
3️⃣ Define Your Risk-Reward Ratio – Ensure your trade aligns with your risk appetite.
4️⃣ Never Trade with Full Capital – Always manage risk and preserve capital.
Trade wisely! ✅📊
Nota
Enter only after neckline breakout with a proper stop loss!Pubblicazioni correlate
Declinazione di responsabilità
The information and publications are not meant to be, and do not constitute, financial, investment, trading, or other types of advice or recommendations supplied or endorsed by TradingView. Read more in the Terms of Use.
Pubblicazioni correlate
Declinazione di responsabilità
The information and publications are not meant to be, and do not constitute, financial, investment, trading, or other types of advice or recommendations supplied or endorsed by TradingView. Read more in the Terms of Use.
