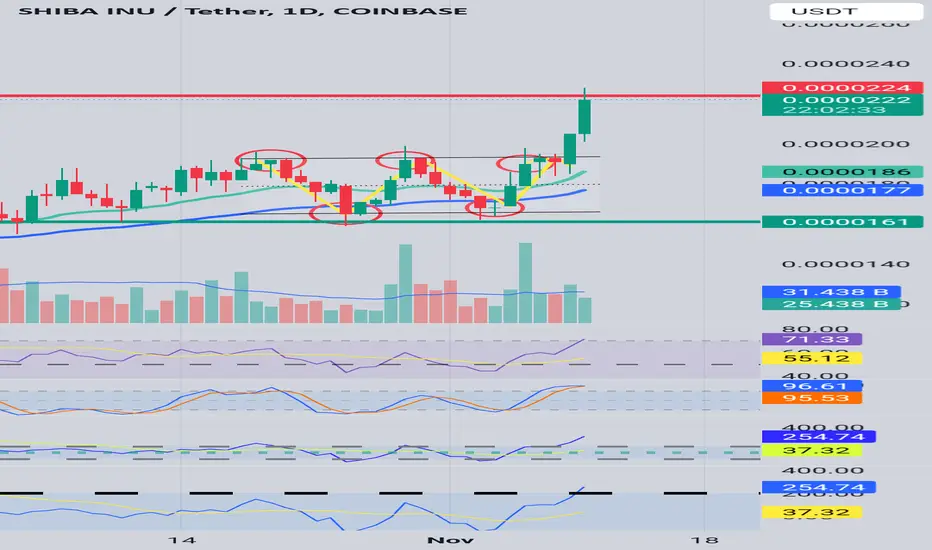
Is the double bottom formation complete even though the day chart candle did not print yet? there is a possibility of a slight pull back, a correction? hypothesizing because of the double bottom and the successful and blessed positive move after that.
Positives- weekly candle is above the 50 EMA
Day candle currently over 21 and 50 EMA
Weekly Chart has cup and handle forming
Negatives- SRSI and RSI and CCI on day chart both indicate asset is overbought. Very close to a key level possible resistance.
Positives- weekly candle is above the 50 EMA
Day candle currently over 21 and 50 EMA
Weekly Chart has cup and handle forming
Negatives- SRSI and RSI and CCI on day chart both indicate asset is overbought. Very close to a key level possible resistance.
Declinazione di responsabilità
Le informazioni e le pubblicazioni non sono intese come, e non costituiscono, consulenza o raccomandazioni finanziarie, di investimento, di trading o di altro tipo fornite o approvate da TradingView. Per ulteriori informazioni, consultare i Termini di utilizzo.
Declinazione di responsabilità
Le informazioni e le pubblicazioni non sono intese come, e non costituiscono, consulenza o raccomandazioni finanziarie, di investimento, di trading o di altro tipo fornite o approvate da TradingView. Per ulteriori informazioni, consultare i Termini di utilizzo.