Peace be unto you
Primary Chart: Silver Analysis (Weekly Timeframe)
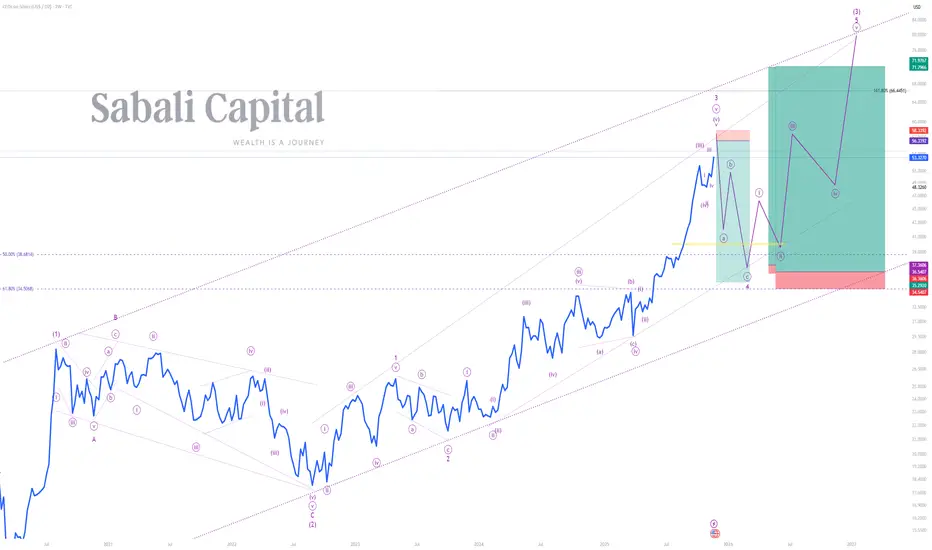
A) Wave Analysis: Minor wave 3 peaks, sharp correction looms
Price is currently completing minor wave 3 that began printing on the 4th of October 2023. Minor wave 1 started printing on the 1st of September 2022 and terminated on the 5th of May 2023. Minor wave 2 sideways correction began when minor wave 1 terminated and terminated when minor wave 3 started printing. Minor wave 4 is expected to be a sharp correction in line with the law of Elliot Waves Guideline on Corrections (Wave 2 and 4) which states that "if wave 2 is a sharp correction, expect wave 4 to be a sideways correction, and vice versa". Thus, minor wave is forecasted to be sharp and retrace to 50% and 61.8% retracement levels of minor wave 3, i.e. minor wave is forecasted to terminated within the 38.6814 and 34.5068 levels before price begins printing minor wave 5 to complete intermediate wave (3) as indicated on the primary chart.
B) Indicator(s) Analysis: Bearish Divergence confirmed and bulls losing altitude. The EMA magnet activated, pullback before the next push. The MACD flips the script, and a seasonal shift is detected.
1) EMA 50 & 150 (Weekly) - Though strongly bullish, price will pull back to touch these moving averages before it continues to rally.
2) RSI 14 (Weekly) - The RSI has rallied above the 70 upper band in August 2025 and reached a peak in October 2025. On the 3rd of November 2025 the RSI reached a trough, and it is now printing a lower high whilst price is printing a higher high. This is known as a Strong Bearish Divergence signaling that bulls are growing weak and that price will collapse on its weight.
3) MACD H (Weekly) - Price has been printing above the MACD centerline indicating that bulls have been strong, but on the 20th of October 2025 we have seen a down close on MACD Histograms indicating a possible trend reversal and a change of season. This is the time to go short.
#SabaliCapital
#TechnicalAnalysis
#PreciousMetals
Primary Chart: Silver Analysis (Weekly Timeframe)
A) Wave Analysis: Minor wave 3 peaks, sharp correction looms
Price is currently completing minor wave 3 that began printing on the 4th of October 2023. Minor wave 1 started printing on the 1st of September 2022 and terminated on the 5th of May 2023. Minor wave 2 sideways correction began when minor wave 1 terminated and terminated when minor wave 3 started printing. Minor wave 4 is expected to be a sharp correction in line with the law of Elliot Waves Guideline on Corrections (Wave 2 and 4) which states that "if wave 2 is a sharp correction, expect wave 4 to be a sideways correction, and vice versa". Thus, minor wave is forecasted to be sharp and retrace to 50% and 61.8% retracement levels of minor wave 3, i.e. minor wave is forecasted to terminated within the 38.6814 and 34.5068 levels before price begins printing minor wave 5 to complete intermediate wave (3) as indicated on the primary chart.
B) Indicator(s) Analysis: Bearish Divergence confirmed and bulls losing altitude. The EMA magnet activated, pullback before the next push. The MACD flips the script, and a seasonal shift is detected.
1) EMA 50 & 150 (Weekly) - Though strongly bullish, price will pull back to touch these moving averages before it continues to rally.
2) RSI 14 (Weekly) - The RSI has rallied above the 70 upper band in August 2025 and reached a peak in October 2025. On the 3rd of November 2025 the RSI reached a trough, and it is now printing a lower high whilst price is printing a higher high. This is known as a Strong Bearish Divergence signaling that bulls are growing weak and that price will collapse on its weight.
3) MACD H (Weekly) - Price has been printing above the MACD centerline indicating that bulls have been strong, but on the 20th of October 2025 we have seen a down close on MACD Histograms indicating a possible trend reversal and a change of season. This is the time to go short.
#SabaliCapital
#TechnicalAnalysis
#PreciousMetals
Declinazione di responsabilità
Le informazioni e le pubblicazioni non sono intese come, e non costituiscono, consulenza o raccomandazioni finanziarie, di investimento, di trading o di altro tipo fornite o approvate da TradingView. Per ulteriori informazioni, consultare i Termini di utilizzo.
Declinazione di responsabilità
Le informazioni e le pubblicazioni non sono intese come, e non costituiscono, consulenza o raccomandazioni finanziarie, di investimento, di trading o di altro tipo fornite o approvate da TradingView. Per ulteriori informazioni, consultare i Termini di utilizzo.