📊 SMCI Technical Analysis (4H Chart)
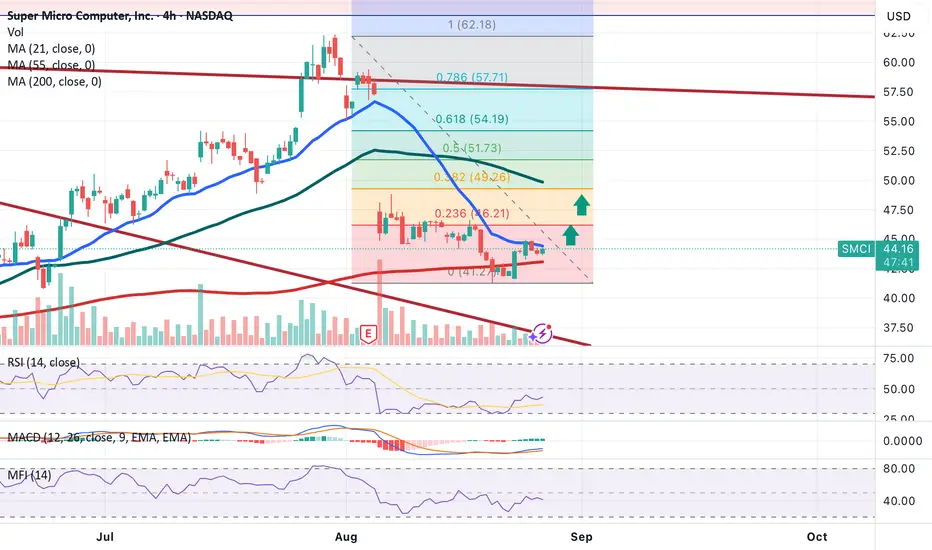
SMCI price action has rebounded strongly from the 200-period moving average, confirming it as a key dynamic support zone.
✅ This bounce signals renewed bullish momentum.
🎯 Upside targets to watch:
First target: $46.21
Second target: $49.26
As long as price holds above the 200 MA, the bullish outlook remains intact. A break below would invalidate this setup.
Trade attivo
🎯 SMCI First price target of $46.21 successfully reached.
✅ Target 1: Hit
🔄 Awaiting continuation toward next resistance/target zone.
Holding long — setup still valid unless key support breaks.
📌 Stay tuned for the next level!
Trade chiuso: obiettivo raggiunto
💡 SMCI has successfully hit and exceeded the second target of $49.26, supported by strong volume.📊 While the stock shows potential for further upside with additional targets, I’ve decided to end my trade here and lock in profits.
🔒 Trade closed.
Declinazione di responsabilità
The information and publications are not meant to be, and do not constitute, financial, investment, trading, or other types of advice or recommendations supplied or endorsed by TradingView. Read more in the Terms of Use.
Declinazione di responsabilità
The information and publications are not meant to be, and do not constitute, financial, investment, trading, or other types of advice or recommendations supplied or endorsed by TradingView. Read more in the Terms of Use.