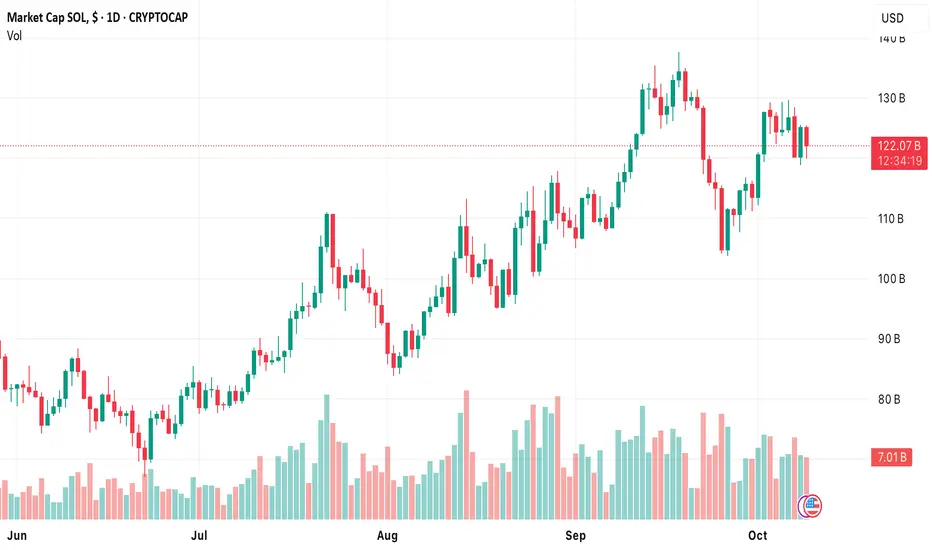
The SOL/USD pair continues to trade within a long-term upward channel, but since the start of October, momentum has slowed, pushing price action into a sideways range between 234.38 and 218.75 (Murray [7/8]–[6/8]). The market has failed to break out of this corridor so far.
A break above 234.38 would confirm bullish continuation toward 250.00, 265.62 (Murray [+1/8], upper channel boundary), and 281.25 (Murray [+2/8]). Conversely, a drop below 218.75 — the midline of the Bollinger Bands — could trigger a deeper pullback to 183.80 (50% Fibonacci retracement) and potentially push SOL out of its current range.
⸻
Technical View
Indicators remain mixed:
• Bollinger Bands are flat, reflecting consolidation.
• The MACD histogram has turned positive, signaling fading bearish pressure.
• Stochastic is turning lower from the overbought zone, hinting at short-term cooling.
On the weekly chart, however, the broader bullish trend remains intact, confirming that Solana is still positioned within its long-term uptrend channel.
⸻
Support and Resistance Levels
• Resistance: 234.38, 250.00, 265.62, 281.25
• Support: 218.75, 183.80
⸻
Trading Scenarios
Bullish Scenario:
Long positions may be considered above 234.38, with targets at 250.00, 265.62, and 281.25, and a stop-loss at 223.00.
Implementation horizon: 5–7 days.
Bearish Scenario:
Short positions could be opened below 218.75, with a target at 183.80 and a stop-loss at 237.00.
⸻
Outlook:
Solana remains in a consolidation phase within its ascending structure. A breakout above 234.38 could signal the start of a new bullish impulse, while failure to hold 218.75 would open the door for a deeper retracement toward 183.80.
Declinazione di responsabilità
Le informazioni ed i contenuti pubblicati non costituiscono in alcun modo una sollecitazione ad investire o ad operare nei mercati finanziari. Non sono inoltre fornite o supportate da TradingView. Maggiori dettagli nelle Condizioni d'uso.
Declinazione di responsabilità
Le informazioni ed i contenuti pubblicati non costituiscono in alcun modo una sollecitazione ad investire o ad operare nei mercati finanziari. Non sono inoltre fornite o supportate da TradingView. Maggiori dettagli nelle Condizioni d'uso.
