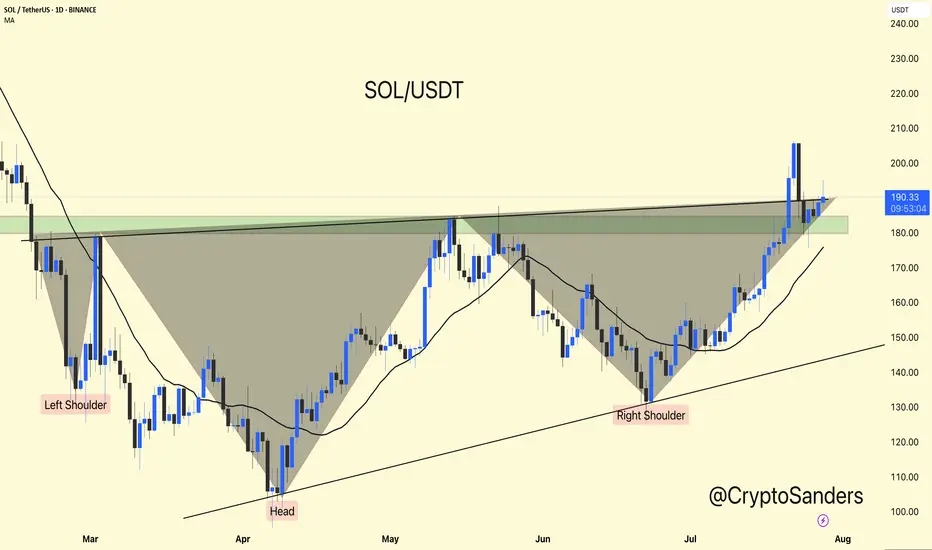
Solana has completed a classic Inverse Head and Shoulders pattern, breaking out above the neckline near the $185–$190 zone.
Currently holding above the breakout zone, showing bullish strength.
As long as SOL stays above the neckline support, continuation toward $210–$230 remains likely.
Trend remains strong above the moving average.
Stay updated and manage your risk accordingly.
DYOR | NFA
Currently holding above the breakout zone, showing bullish strength.
As long as SOL stays above the neckline support, continuation toward $210–$230 remains likely.
Trend remains strong above the moving average.
Stay updated and manage your risk accordingly.
DYOR | NFA
Pubblicazioni correlate
Declinazione di responsabilità
Le informazioni ed i contenuti pubblicati non costituiscono in alcun modo una sollecitazione ad investire o ad operare nei mercati finanziari. Non sono inoltre fornite o supportate da TradingView. Maggiori dettagli nelle Condizioni d'uso.
Pubblicazioni correlate
Declinazione di responsabilità
Le informazioni ed i contenuti pubblicati non costituiscono in alcun modo una sollecitazione ad investire o ad operare nei mercati finanziari. Non sono inoltre fornite o supportate da TradingView. Maggiori dettagli nelle Condizioni d'uso.
