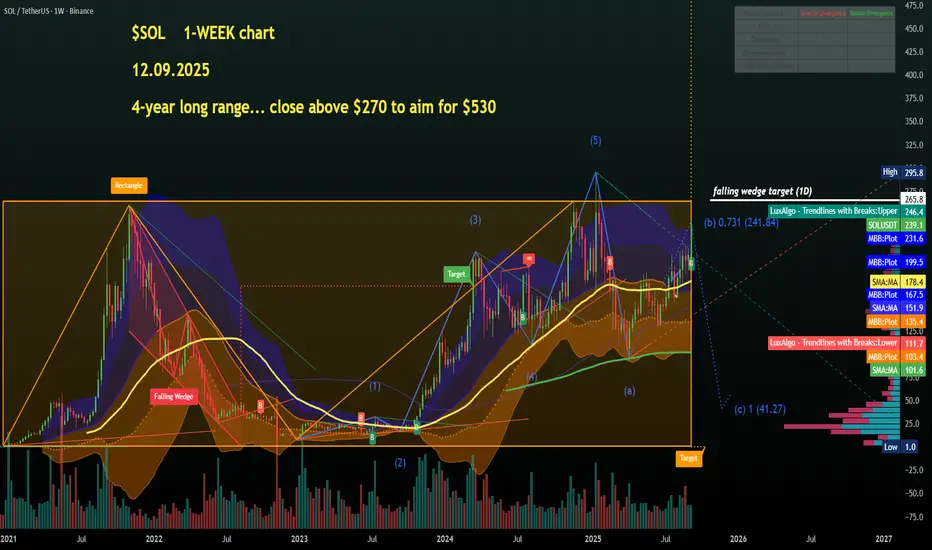
So, first of all a huge range since the beginning of 2021, let's call that a rectangle pattern giving us a clear long-term breakout level on weekly candle close above $265-$275, the higher the better.
RSI upcurved nicely at 66 so plenty of room to grow in Q4.
From there we would have a target of around $525, not unrealistic. Daily view next💙👽☝️
Declinazione di responsabilità
Le informazioni ed i contenuti pubblicati non costituiscono in alcun modo una sollecitazione ad investire o ad operare nei mercati finanziari. Non sono inoltre fornite o supportate da TradingView. Maggiori dettagli nelle Condizioni d'uso.
Declinazione di responsabilità
Le informazioni ed i contenuti pubblicati non costituiscono in alcun modo una sollecitazione ad investire o ad operare nei mercati finanziari. Non sono inoltre fornite o supportate da TradingView. Maggiori dettagli nelle Condizioni d'uso.