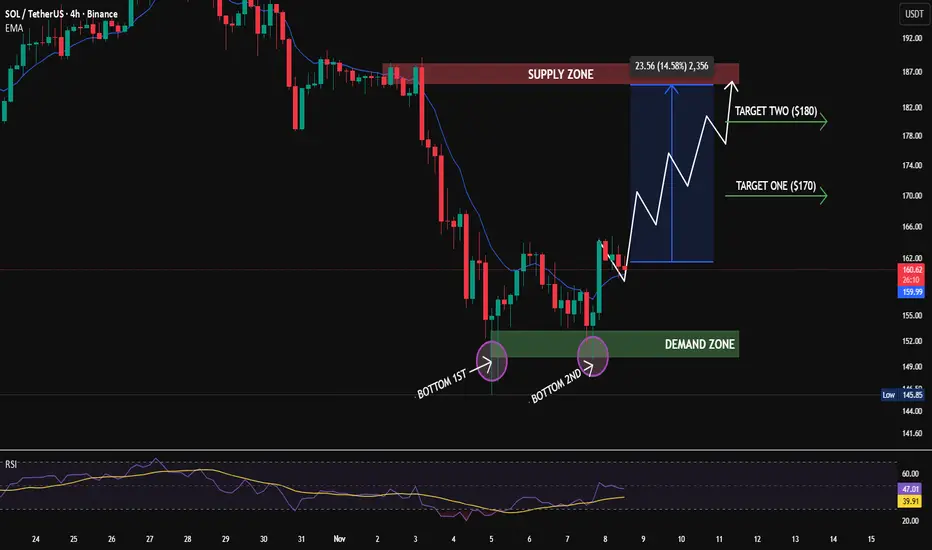
The chart shows SOL forming a double bottom at a strong demand zone, indicating a potential bullish reversal. Price has bounced twice from the same support region, showing clear buyer aggression and seller exhaustion, with a projected move toward the upper supply zone.
Key Observations
🔹 Demand Zone: $148 – $152 — strong support where both bottoms formed, triggering buyer interest.
🔹 Double Bottom Formation: Two clean touches confirming reversal structure.
🔹 Supply Zone: $183 – $187 — key resistance where sellers may step in.
🔹 EMA (10): Price is attempting to reclaim it; a close above the EMA would confirm momentum shift.
🔹 RSI: Currently around 47 — rising from lower levels, signaling early bullish momentum with room to move higher.
🔹 Structure: As long as SOL holds above the demand zone, the bullish reversal setup remains intact.
Potential Move
If SOL continues to hold above the $148–$152 demand zone, the next
upside targets are:
🎯 Target 1: $170
🎯 Target 2: $180
A breakdown below $148 could invalidate the reversal and push the price back toward deeper support levels.
Summary:
SOL is showing a strong double-bottom reversal from a key demand zone, supported by improving RSI and EMA interaction. Holding above $150 keeps the bullish structure active, with a potential continuation move toward $170–$180, followed by a retest of the supply zone near $185.
.
.
#coinpediamarkets #SOL #SOLUSDT #CryptoAnalysis #TechnicalAnalysis #Altcoins #DemandZone #SupplyZone #BullishTrend
Declinazione di responsabilità
The information and publications are not meant to be, and do not constitute, financial, investment, trading, or other types of advice or recommendations supplied or endorsed by TradingView. Read more in the Terms of Use.
Declinazione di responsabilità
The information and publications are not meant to be, and do not constitute, financial, investment, trading, or other types of advice or recommendations supplied or endorsed by TradingView. Read more in the Terms of Use.