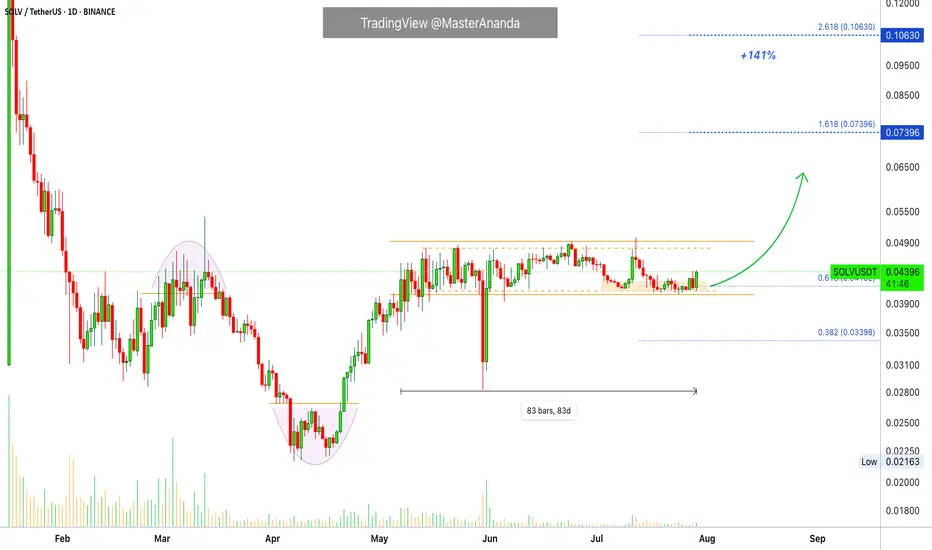
Solv Protocol has been sideways for 83 days, and it looks ready to rise. The market bottomed in April and afterward has been bullish ever since. It is nice to see how tight the trading range is.
This chart pattern is not very common. When a pair has a chart drawing that is not seen often, it means that it can move differently to others. It can go down while others are going up, but it can also go up while others go down.
The action is happening near the lower boundary of the range, perfect to buy as the action happens near support. When at resistance we can expect a drop; at support, a rise. And here SOLVUSDT seems eager to start rising.
With a close today above 0.04411, we get a strong signal for additional growth. The breakout can happen within a few days but the trend that follows can last for months. Catching the breakout can be nice and fun. Sometimes they reverse though to grow only after a few weeks.
Namaste.
🚨 Get the FULL (5-in-1) PREMIUM PACKAGE
lamatrades.com —Since 2017
🚨 TOP Results: ZEC +2736% · ETH +2150%, CRO +1272%, AAVE +1134%, DOGS +868%, SOL +861%, XRP +749%, BTC +580%
More 👉 t.me/masteranandatrades/6681
lamatrades.com —Since 2017
🚨 TOP Results: ZEC +2736% · ETH +2150%, CRO +1272%, AAVE +1134%, DOGS +868%, SOL +861%, XRP +749%, BTC +580%
More 👉 t.me/masteranandatrades/6681
Pubblicazioni correlate
Declinazione di responsabilità
Le informazioni e le pubblicazioni non sono intese come, e non costituiscono, consulenza o raccomandazioni finanziarie, di investimento, di trading o di altro tipo fornite o approvate da TradingView. Per ulteriori informazioni, consultare i Termini di utilizzo.