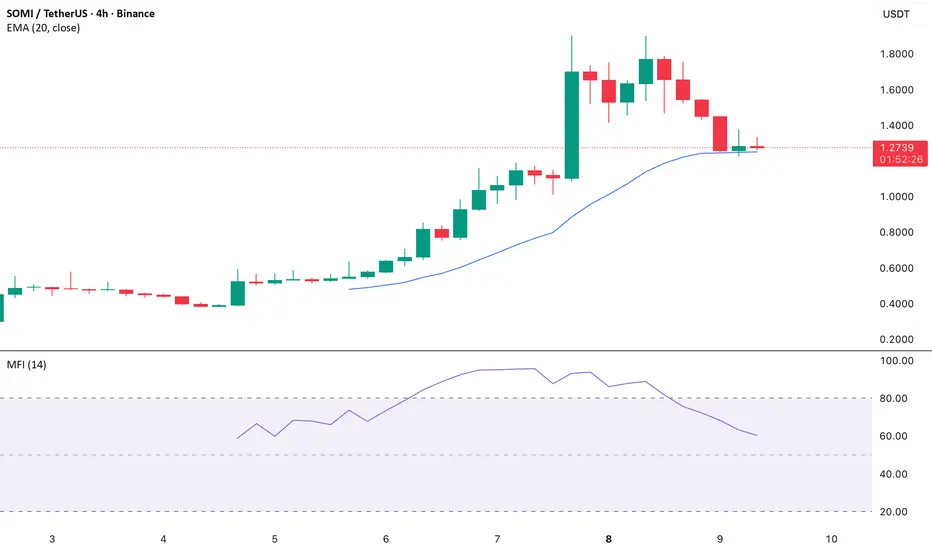
On the SOMI/USD four-hour chart, the Money Flow Index (MFI) has been trending downward, indicating a rise in selloffs. Since the MFI accounts for both price and volume, a decline confirms that sellers are steadily gaining control while buyers lose momentum.
SOMI’s recent price action has brought it closer to the 20-day Exponential Moving Average (EMA), underscoring fading buy-side strength. The EMA serves as a key gauge of short-term market sentiment—trading above it signals sustained bullishness, while a breakdown below suggests a bearish shift.
If SOMI closes decisively below the 20-day EMA, it would signal a move away from the token’s early post-launch optimism toward a more bearish phase. Such a breakdown could invite heavier selling pressure, paving the way for deeper losses ahead.
Leader in crypto news, award winning journalism in 26 languages.
Declinazione di responsabilità
Le informazioni e le pubblicazioni non sono intese come, e non costituiscono, consulenza o raccomandazioni finanziarie, di investimento, di trading o di altro tipo fornite o approvate da TradingView. Per ulteriori informazioni, consultare i Termini di utilizzo.