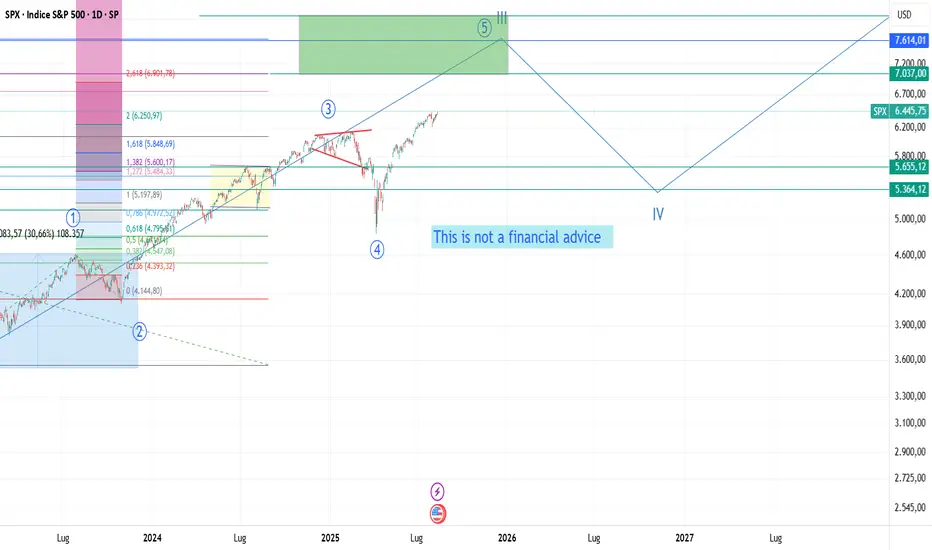
The S&P 500 has just surpassed the 6,400-point mark for the first time in history, setting a new all-time record. A movement which, for enthusiasts of technical analysis and Elliott Wave Theory, could represent the beginning of a Primary Wave 5: tcould represent the continuation of a Primary Wave 5: the final phase of a long-term bullish impulse, often characterized by euphoric accelerations and new record highs.
Yet this is happening in the midst of an economic slowdown, an apparent paradox that deserves to be explained.
1. Monetary Policy and Interest Rate Expectations
Central banks, faced with a slowdown, tend to cut interest rates or signal more accommodative policies. Equity markets, looking 6–12 months ahead, quickly price in the expectation of a recovery supported by easier credit conditions.
2. Excess Liquidity
Monetary and fiscal stimulus, even during a contraction, can flood the system with liquidity. With low bond yields, investors shift capital into equities, driving prices higher.
3. Concentration of Performance
The S&P 500 is market-cap weighted: exceptional performance by a few giants (such as the “Magnificent Seven”) can pull the index higher even if many other companies struggle. Sectors like technology and healthcare can continue growing even in weak economic conditions.
4. Confidence in Future Earnings
The market often bets on an earnings recovery before macroeconomic data improve. Cost-cutting and corporate restructuring, implemented during slowdowns, can lay the foundation for higher margins in the next cycle.
5. Technical and Behavioral Factors
Breakouts above previous record highs trigger automatic buying orders and short covering, amplifying the bullish move. Investor psychology can further increase the detachment from macro fundamentals.
6. Decoupling Between Companies and the Real Economy
Large multinational corporations in the S&P 500 often generate most of their revenues abroad, making them less vulnerable to domestic economic contractions. As a result, the stock market can reflect the outlook for these global companies rather than the domestic economy.
I have decided to publish a monthly update in relation to this chart: what will be the S&P 500’s all-time high?
In the chart, I have shared my study:
This is purely a technical analysis study based on quantitative analysis, on numbers and probabilities that a certain move might have. It is not financial advice.
Declinazione di responsabilità
Le informazioni e le pubblicazioni non sono intese come, e non costituiscono, consulenza o raccomandazioni finanziarie, di investimento, di trading o di altro tipo fornite o approvate da TradingView. Per ulteriori informazioni, consultare i Termini di utilizzo.
Declinazione di responsabilità
Le informazioni e le pubblicazioni non sono intese come, e non costituiscono, consulenza o raccomandazioni finanziarie, di investimento, di trading o di altro tipo fornite o approvate da TradingView. Per ulteriori informazioni, consultare i Termini di utilizzo.