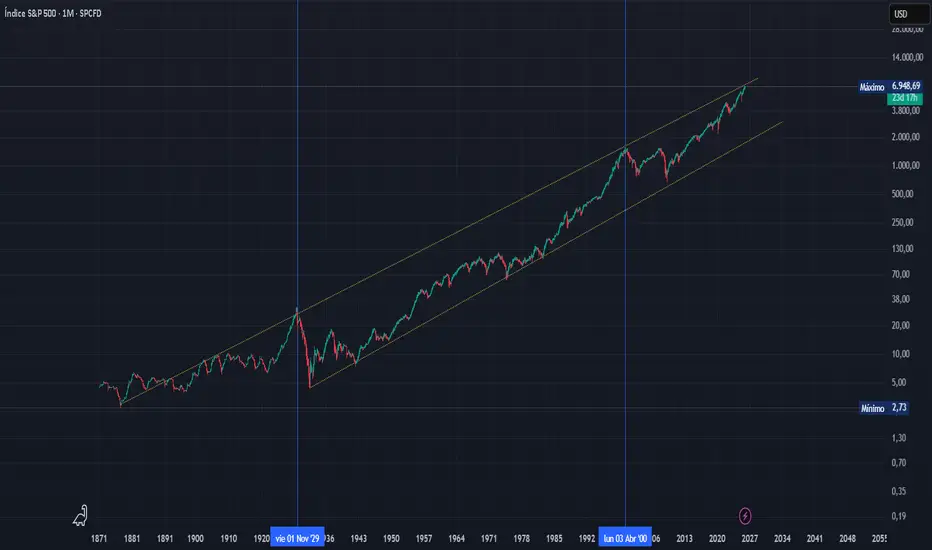
S&P 500 Monthly – Historical Logarithmic Chart –
The S&P 500 is approaching long-term resistance seen in 1929 and 2000.
In log scale, this represents limits to sustained percentage growth, highlighting elevated valuations and potential caution.
Historically, similar levels have led to deep corrections, sideways consolidation, or rare breakouts.
Key takeaway : At this stage, disciplined caution and selective positioning tend to generate better long-term alpha than chasing broad market gains.
Declinazione di responsabilità
Le informazioni e le pubblicazioni non sono intese come, e non costituiscono, consulenza o raccomandazioni finanziarie, di investimento, di trading o di altro tipo fornite o approvate da TradingView. Per ulteriori informazioni, consultare i Termini di utilizzo.
Declinazione di responsabilità
Le informazioni e le pubblicazioni non sono intese come, e non costituiscono, consulenza o raccomandazioni finanziarie, di investimento, di trading o di altro tipo fornite o approvate da TradingView. Per ulteriori informazioni, consultare i Termini di utilizzo.