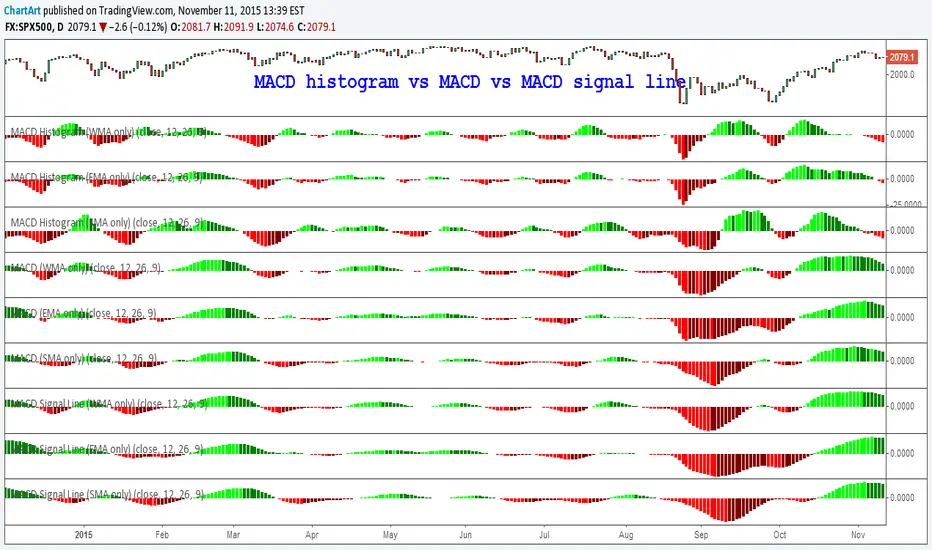
This is the final overview of my research into the MACD (Moving Average Convergence/Divergence) indicator, which is showing part 1, part 2 to part 3 all together in just one chart.
Overall there are nine MACD indicator variations on this chart, because each of the three parts is a comparisons of three different calculation methods (simple moving average vs exponential moving average vs weighted moving average) of each the three different MACD time series components:
Part 1: MACD histogram (difference between MACD and signal line)
![[STUDY] MACD. Part 1: Histogram (Comparison of moving averages)](https://s3.tradingview.com/e/eRSEmsKW_mid.png)
Part 2: MACD (difference between fast and slow moving average)
![[STUDY] MACD. Part 2: MACD (Comparison of moving averages)](https://s3.tradingview.com/d/DGqbSSAk_mid.png)
Part 3: MACD signal line (moving average of the difference between the fast and slow moving averages)
![[STUDY] MACD. Part 3 Signal Line (Comparison of moving averages)](https://s3.tradingview.com/l/LZtLjjzg_mid.png)
P.S. Here is the mathematical interpretation of the MACD indicator:
Source: stockcharts.com/school/doku.php?id=chart_school:technical_indicators:macd-histogram
According to Wikipedia "for the standard MACD filter time constants of 12 and 26 periods, the MACD derivative estimate is filtered approximately by the equivalent of a low-pass moving average filter of 38 data periods. The time derivative estimate (per period) is the MACD value divided by 14."
Source: en.wikipedia.org/wiki/MACD
Overall there are nine MACD indicator variations on this chart, because each of the three parts is a comparisons of three different calculation methods (simple moving average vs exponential moving average vs weighted moving average) of each the three different MACD time series components:
Part 1: MACD histogram (difference between MACD and signal line)
Part 2: MACD (difference between fast and slow moving average)
Part 3: MACD signal line (moving average of the difference between the fast and slow moving averages)
P.S. Here is the mathematical interpretation of the MACD indicator:
- First derivative: fast moving average (12) and slow moving average (26)
- Second derivative: MACD (fast moving average (12) less the slow moving average (26))
- Third derivative: MACD signal line (moving average (9) of MACD)
- Fourth derivative: MACD-Histogram (MACD less MACD signal line)
Source: stockcharts.com/school/doku.php?id=chart_school:technical_indicators:macd-histogram
According to Wikipedia "for the standard MACD filter time constants of 12 and 26 periods, the MACD derivative estimate is filtered approximately by the equivalent of a low-pass moving average filter of 38 data periods. The time derivative estimate (per period) is the MACD value divided by 14."
Source: en.wikipedia.org/wiki/MACD
Pubblicazioni correlate
Declinazione di responsabilità
Le informazioni ed i contenuti pubblicati non costituiscono in alcun modo una sollecitazione ad investire o ad operare nei mercati finanziari. Non sono inoltre fornite o supportate da TradingView. Maggiori dettagli nelle Condizioni d'uso.
Pubblicazioni correlate
Declinazione di responsabilità
Le informazioni ed i contenuti pubblicati non costituiscono in alcun modo una sollecitazione ad investire o ad operare nei mercati finanziari. Non sono inoltre fornite o supportate da TradingView. Maggiori dettagli nelle Condizioni d'uso.