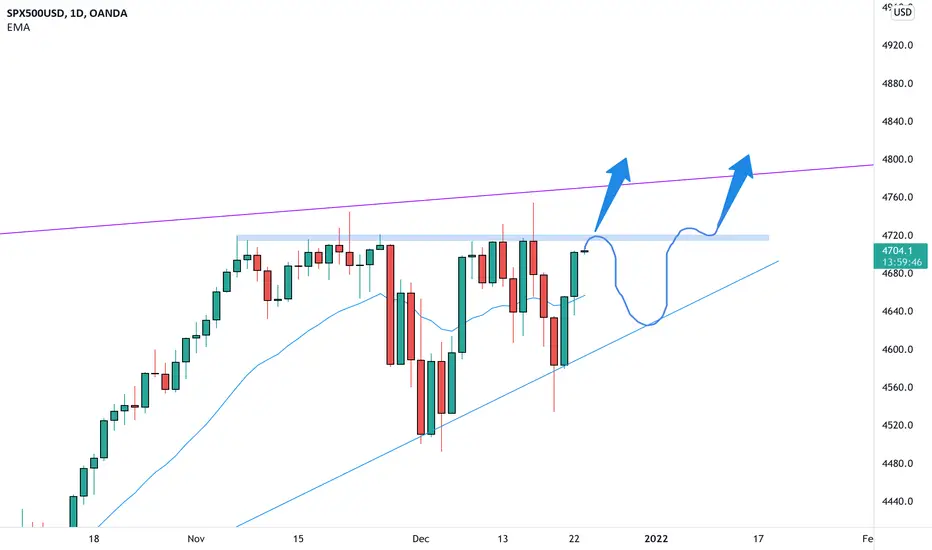
SP500 on the daily chart is trading between an ascending trendline and a daily resistance.
The price is now moving to the upper structure and we can see 2 possible scenarios where one is a rejection and the continuation in a possible triangle pattern.
The other is the break above with the consequent new ath.
––––
Follow the Shrimp 🦐
Keep in mind.
• 🟣 Purple structure -> Monthly structure.
• 🔴 Red structure -> Weekly structure.
• 🔵 Blue structure -> Daily structure.
• 🟡 Yellow structure -> 4h structure.
• ⚫️ Black structure -> >4h structure.
Here is the Plancton0618 technical analysis , please comment below if you have any question.
The ENTRY in the market will be taken only if the condition of the Plancton0618 strategy will trigger.
Nota
Nota
Nota
Nota
ATH Nota
Nota
NEW ATH Nota
Declinazione di responsabilità
Le informazioni ed i contenuti pubblicati non costituiscono in alcun modo una sollecitazione ad investire o ad operare nei mercati finanziari. Non sono inoltre fornite o supportate da TradingView. Maggiori dettagli nelle Condizioni d'uso.
Declinazione di responsabilità
Le informazioni ed i contenuti pubblicati non costituiscono in alcun modo una sollecitazione ad investire o ad operare nei mercati finanziari. Non sono inoltre fornite o supportate da TradingView. Maggiori dettagli nelle Condizioni d'uso.