SPX-----
Structure Detected
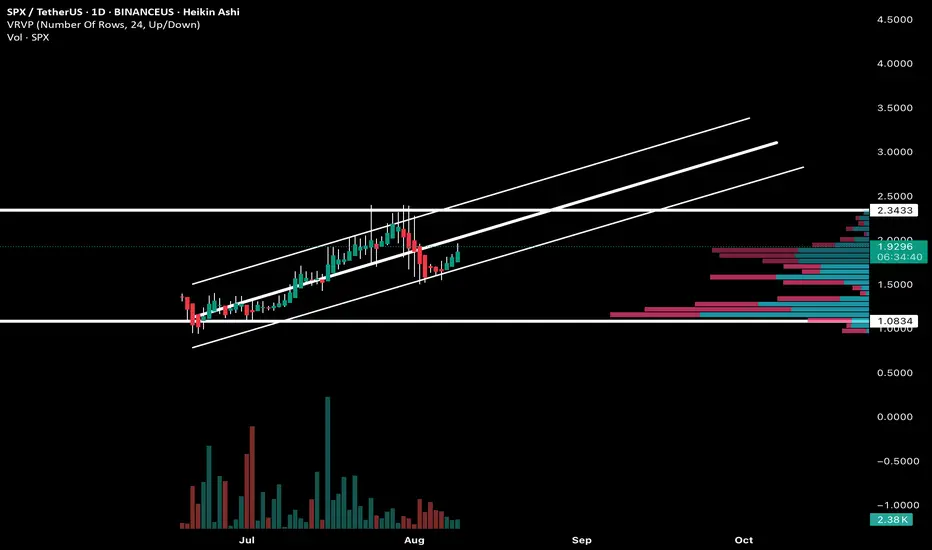
Price is in a rising parallel channel with multiple touches on both upper and lower trendlines — a sustained bullish structure since the left side of the chart.
Recently, price pulled back to the lower channel boundary and is now bouncing upward.
There’s a horizontal resistance around 2.3433 and a major support base near 1.08.
Volume profile (VRVP) shows high-volume node around the current price (1.93), meaning this area has been heavily traded — often a pivot zone.
The recent candles show consecutive green Heikin Ashi candles, indicating current bullish momentum after the correction.
Market Bias
Short-term: Bullish (rebound from lower channel, green candles, reclaim attempt of mid-channel).
Medium-term: Still bullish while inside the ascending channel, but caution near the 2.34 resistance as it’s been a rejection zone before.
Bullish Targets
2.00 – 2.05 → reclaim and hold to confirm momentum.
2.34 (major resistance and top of volume profile) — key breakout point.
If 2.34 breaks with conviction, upside targets move toward ~2.80 – 3.00 (upper channel).
Bearish Levels / Invalidation
First warning if price closes back below ~1.75 (loses mid-channel support).
Strong breakdown confirmation if 1.50 fails (mid-volume node).
Full structure breakdown below 1.0834 — would invalidate the bullish channel.
🕰️ Timeframe-Based Targets
Daily Swing Targets:
Upside: 2.00 → 2.34 → 2.80
Downside: 1.75 → 1.50 → 1.083
Summary:
SPXUSDT is still in a broader uptrend channel and is currently bouncing from the lower boundary. The immediate battle is reclaiming the 1.93–2.00 zone to set up a run toward 2.34. A rejection there could send price back toward 1.75–1.50, but until the lower channel breaks, the structure remains bullish.
Declinazione di responsabilità
Le informazioni ed i contenuti pubblicati non costituiscono in alcun modo una sollecitazione ad investire o ad operare nei mercati finanziari. Non sono inoltre fornite o supportate da TradingView. Maggiori dettagli nelle Condizioni d'uso.
Declinazione di responsabilità
Le informazioni ed i contenuti pubblicati non costituiscono in alcun modo una sollecitazione ad investire o ad operare nei mercati finanziari. Non sono inoltre fornite o supportate da TradingView. Maggiori dettagli nelle Condizioni d'uso.
