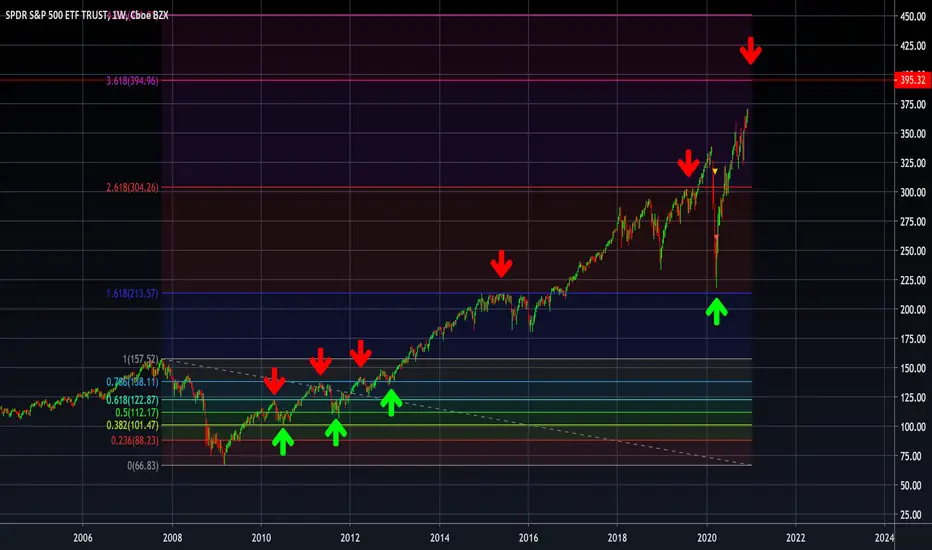
This chart shows the Fibonacci retracement and extension levels from the 2008 crash until now and points out times when they acted as support and resistance. The next resistance level is $395. Due to my expectation that the market will continue to rally due to a number of factors, $395 is my price target. This is in line with my most recent analysis which suggested a price target at $398 using pattern repetition.
Declinazione di responsabilità
Le informazioni ed i contenuti pubblicati non costituiscono in alcun modo una sollecitazione ad investire o ad operare nei mercati finanziari. Non sono inoltre fornite o supportate da TradingView. Maggiori dettagli nelle Condizioni d'uso.
Declinazione di responsabilità
Le informazioni ed i contenuti pubblicati non costituiscono in alcun modo una sollecitazione ad investire o ad operare nei mercati finanziari. Non sono inoltre fornite o supportate da TradingView. Maggiori dettagli nelle Condizioni d'uso.
