Alright, so  SUI is the most requested coin for me to cover, let's go starting with the WEEKLY view, the DAILY, 4-hour and the HOURLY charts in next posts later on this evening.
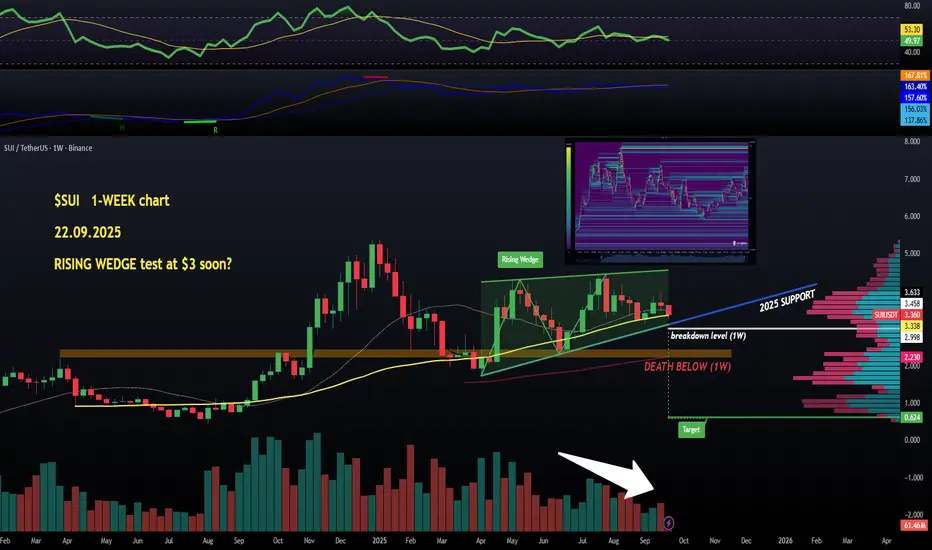
So the weekly has got one chart pattern to worry about, the 5-month-old RISING WEDGE which is basically a red flag despite making higher highs and higher low (bullish market structure intact).
#SUİ is still a touch above the yellow (50 MA) line, and key levels to watch are the $3 mark (breakdown level) and the blue rising support. We really don't want to lose any of these levels.
Actually, I will look for some shorts below $3.
Liquidity wise, not much to clear below the price, and a lot of it above the last local highs. See the attached Liquidity Map.
Next posts to continue the analysis on shorter timeframes☝️👽
Declinazione di responsabilità
Le informazioni e le pubblicazioni non sono intese come, e non costituiscono, consulenza o raccomandazioni finanziarie, di investimento, di trading o di altro tipo fornite o approvate da TradingView. Per ulteriori informazioni, consultare i Termini di utilizzo.
Declinazione di responsabilità
Le informazioni e le pubblicazioni non sono intese come, e non costituiscono, consulenza o raccomandazioni finanziarie, di investimento, di trading o di altro tipo fornite o approvate da TradingView. Per ulteriori informazioni, consultare i Termini di utilizzo.