SUI/USDT - 4-Hour Chart Analysis: Potential Bullish Continuation
This analysis focuses on the 4-hour chart of SUI/USDT on Binance. Key observations include:
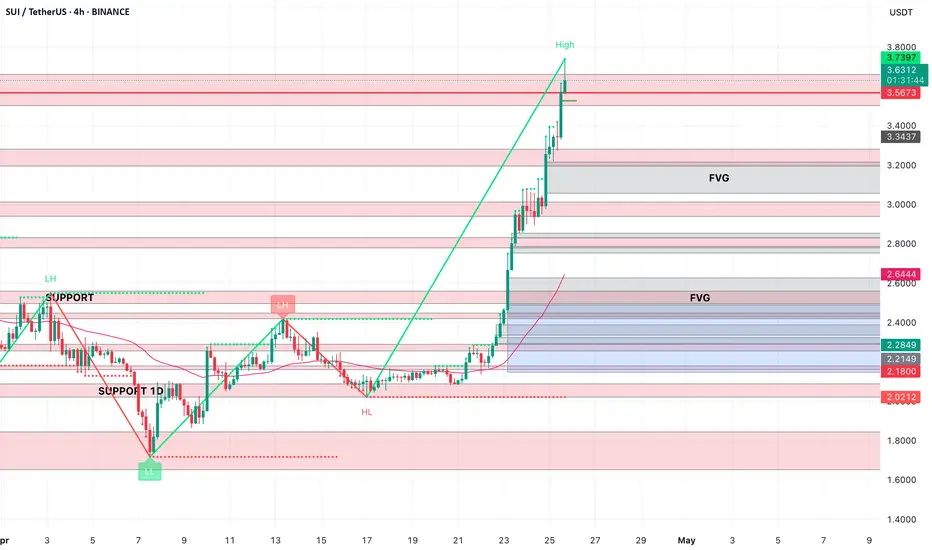
Current Price: SUI is trading at $3.6423, up 1.95% from the previous close.
Recent High: The recent high is $3.7397.
Support Levels: Key support levels are identified at $2.12 and $1.80. There's also a support zone labeled "SUPPORT 1D."
Fair Value Gap (FVG): There are two Fair Value Gaps (FVG) marked on the chart, one above the current price and one below, which could act as potential areas of interest.
Potential Bullish Trend: The chart suggests a potential continuation of the bullish trend, with the price moving upwards from the support levels.
Disclaimer: This is not financial advice. Please do your own research before making any trading decisions.
This analysis focuses on the 4-hour chart of SUI/USDT on Binance. Key observations include:
Current Price: SUI is trading at $3.6423, up 1.95% from the previous close.
Recent High: The recent high is $3.7397.
Support Levels: Key support levels are identified at $2.12 and $1.80. There's also a support zone labeled "SUPPORT 1D."
Fair Value Gap (FVG): There are two Fair Value Gaps (FVG) marked on the chart, one above the current price and one below, which could act as potential areas of interest.
Potential Bullish Trend: The chart suggests a potential continuation of the bullish trend, with the price moving upwards from the support levels.
Disclaimer: This is not financial advice. Please do your own research before making any trading decisions.
Declinazione di responsabilità
Le informazioni ed i contenuti pubblicati non costituiscono in alcun modo una sollecitazione ad investire o ad operare nei mercati finanziari. Non sono inoltre fornite o supportate da TradingView. Maggiori dettagli nelle Condizioni d'uso.
Declinazione di responsabilità
Le informazioni ed i contenuti pubblicati non costituiscono in alcun modo una sollecitazione ad investire o ad operare nei mercati finanziari. Non sono inoltre fornite o supportate da TradingView. Maggiori dettagli nelle Condizioni d'uso.