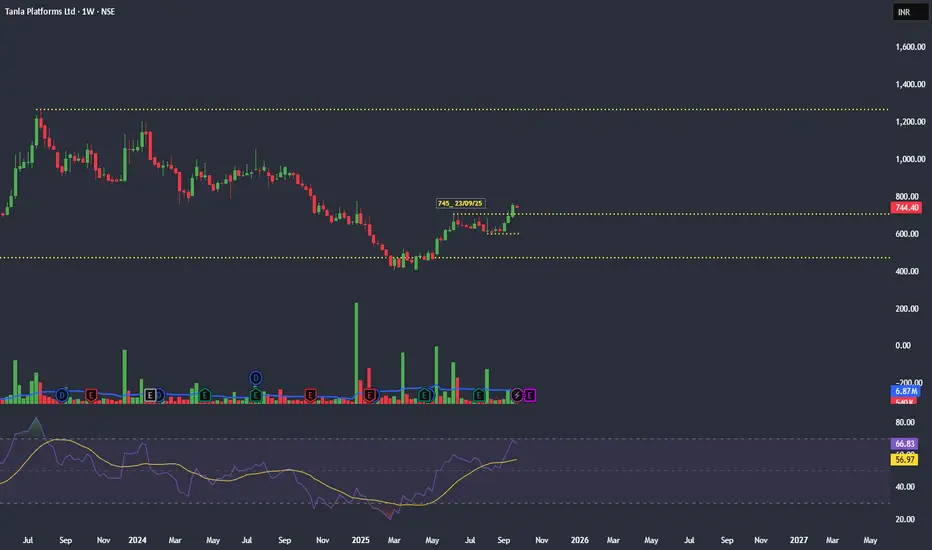
Price Action
CMP: ~₹685–690 (Sept 19, 2025)
Stock has been in a steady uptrend, consolidating above key support zones.
Trading well above 50 / 100 / 200 EMAs → strong structural trend.
Volume & Market Structure
Accumulation phase.
Price action forming a tight consolidation box between ₹670–₹700 → breakout likely if volumes expand further.
Sustained breakout above ₹700 with heavy volume can open room for a strong rally.
Indicators & Momentum
RSI (14): ~67.8 → bullish, nearing overbought but still healthy.
ADX: ~25.5 → moderate trend strength, room to expand further.
50 EMA (~₹645): Price trading above → confirms short-term strength.
100 EMA (~₹627): Price comfortably above → medium-term bullish.
200 EMA (~₹645): Price also above → long-term bullish alignment.
Key Levels
Resistance: ₹700 → ₹720 (near-term breakout zones)
Support: ₹670 → ₹650 → ₹627 (EMA cluster support)
Upside Targets
T1: ₹720
T2: ₹760
T3: ₹810 (extended swing target)
Invalidation
Close below ₹650 = short-term caution.
Close below ₹627 (100 EMA) = medium-term weakness.
Trading View Bias
Bias: Bullish above ₹670
Short-Term: ₹700 → ₹720
Medium-Term: ₹760 → ₹810
⚠️ Disclaimer: Educational analysis only, not financial advice. Do your own research before trading.
Declinazione di responsabilità
Le informazioni e le pubblicazioni non sono intese come, e non costituiscono, consulenza o raccomandazioni finanziarie, di investimento, di trading o di altro tipo fornite o approvate da TradingView. Per ulteriori informazioni, consultare i Termini di utilizzo.
Declinazione di responsabilità
Le informazioni e le pubblicazioni non sono intese come, e non costituiscono, consulenza o raccomandazioni finanziarie, di investimento, di trading o di altro tipo fornite o approvate da TradingView. Per ulteriori informazioni, consultare i Termini di utilizzo.