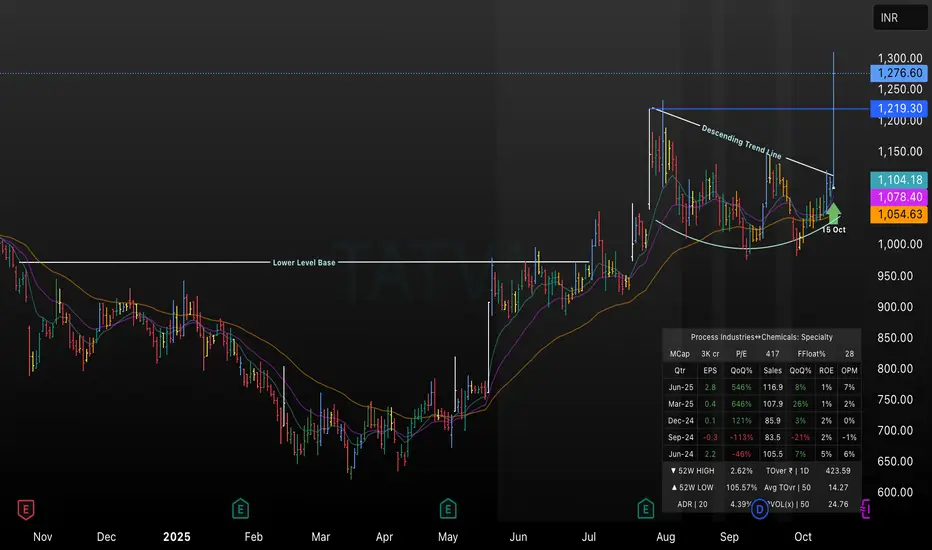
This TradingView chart highlights Tatva’s price action as it breaks above a descending trend line on October 15, 2025, signaling a strong bullish move. Key levels such as the lower base, breakout zone, and price targets (₹1219.30, ₹1276.60, ₹1300.00) are marked, with EMA indicators supporting positive momentum. The chart includes recent fundamentals, making it ideal for technical traders analyzing breakout setups and trend reversals in specialty chemicals stocks for Q4 2025
Declinazione di responsabilità
Le informazioni ed i contenuti pubblicati non costituiscono in alcun modo una sollecitazione ad investire o ad operare nei mercati finanziari. Non sono inoltre fornite o supportate da TradingView. Maggiori dettagli nelle Condizioni d'uso.
Declinazione di responsabilità
Le informazioni ed i contenuti pubblicati non costituiscono in alcun modo una sollecitazione ad investire o ad operare nei mercati finanziari. Non sono inoltre fornite o supportate da TradingView. Maggiori dettagli nelle Condizioni d'uso.