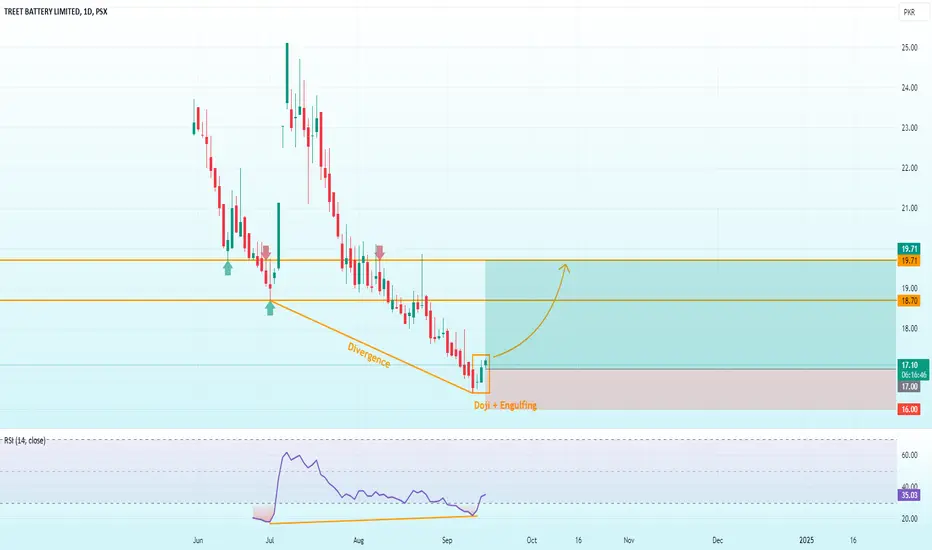
This chart for Treet Battery Limited (TBL) shows a potential bullish reversal after a downtrend:
-Bullish Candlestick Pattern: A Doji followed by a Bullish Engulfing indicates a possible upward reversal.
-Support at PKR 16.00: Price is holding this level.
-Resistance Levels: Key resistances at PKR 18.70 and PKR 19.71.
-RSI Divergence: A bullish divergence with RSI at 33.73 (near oversold), signaling potential upward momentum.
If the support holds, the stock may move toward the PKR 18.70–19.71 resistance zone.
Trade chiuso: stop raggiunto
Stop HuntDeclinazione di responsabilità
Le informazioni ed i contenuti pubblicati non costituiscono in alcun modo una sollecitazione ad investire o ad operare nei mercati finanziari. Non sono inoltre fornite o supportate da TradingView. Maggiori dettagli nelle Condizioni d'uso.
Declinazione di responsabilità
Le informazioni ed i contenuti pubblicati non costituiscono in alcun modo una sollecitazione ad investire o ad operare nei mercati finanziari. Non sono inoltre fornite o supportate da TradingView. Maggiori dettagli nelle Condizioni d'uso.