🔹 Wave Structure Overview
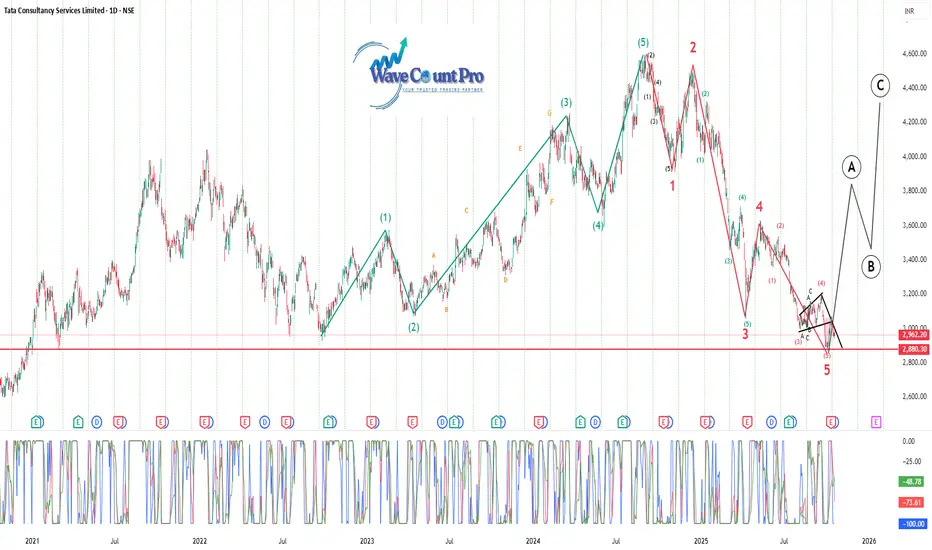
The chart clearly maps a complete 5-wave impulse uptrend (green count) followed by a 5-wave corrective decline (red count).
The current position indicates that Wave 5 of the corrective phase has just completed — signaling a possible end of the downtrend and setup for a bullish reversal.
🔹 Key Observations
Support Zone:
Strong horizontal support lies between ₹2,880–₹2,950, previously tested multiple times since 2021.
Price is currently hovering at this zone, showing signs of consolidation and potential reversal.
Wave Count Analysis:
The correction from the top (~₹4,600) unfolded in a clear 5-wave structure (1–2–3–4–5).
Subwave (5) appears to have terminated near the major support — a typical ending point for an Elliott Wave correction.
Pattern Recognition:
A falling wedge structure can be observed near the Wave 5 termination, which often precedes a bullish breakout.
The oscillator at the bottom also indicates oversold levels, reinforcing the likelihood of a rebound.
🔹 Projected Path (Next Phase)
The chart projects a corrective rally (A–B–C) following the completed 5-wave decline:
Wave A: Initial sharp rebound possibly toward ₹3,600–₹3,700.
Wave B: Pullback to retest lower supports near ₹3,200–₹3,300.
Wave C: Final leg up toward ₹4,200–₹4,400 range.
This A–B–C pattern would represent a corrective recovery phase before the next larger structure develops.
🔹 Sentiment & Outlook
Aspect View
Current Trend Bearish cycle likely completed
Immediate Bias Bullish rebound expected
Support Zone ₹2,880–₹2,950
Upside Targets ₹3,700 (A), ₹4,400 (C)
Invalidation Level Breakdown below ₹2,880
Momentum Oversold, positive divergence forming
🔹 Conclusion
TCS appears to have completed a major correction and is positioned for a medium-term trend reversal.
Holding above ₹2,880 will confirm strength, potentially leading to an A–B–C recovery toward ₹4,400 levels.
Momentum indicators and wave structure both support the beginning of a bullish phase after a prolonged decline.
Technical Analyst BY Passion
Declinazione di responsabilità
Le informazioni e le pubblicazioni non sono intese come, e non costituiscono, consulenza o raccomandazioni finanziarie, di investimento, di trading o di altro tipo fornite o approvate da TradingView. Per ulteriori informazioni, consultare i Termini di utilizzo.