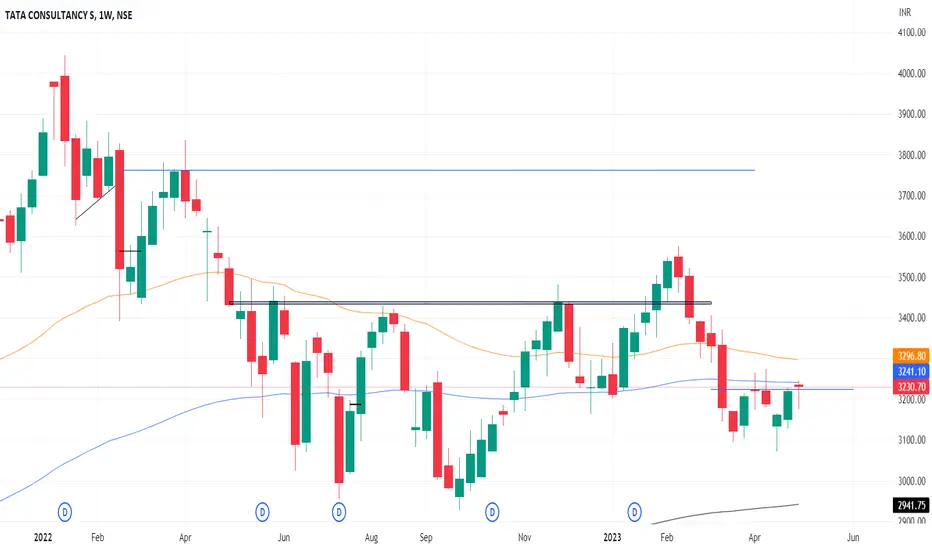
In the Weekly Chart of TCS ,
we can see that, it has a recovery in W pattern.
Bullish Candle is foamed on support.
Enter on breaking its high with Low as SL and Go very Long.
we can see that, it has a recovery in W pattern.
Bullish Candle is foamed on support.
Enter on breaking its high with Low as SL and Go very Long.
Declinazione di responsabilità
Le informazioni e le pubblicazioni non sono intese come, e non costituiscono, consulenza o raccomandazioni finanziarie, di investimento, di trading o di altro tipo fornite o approvate da TradingView. Per ulteriori informazioni, consultare i Termini di utilizzo.
Declinazione di responsabilità
Le informazioni e le pubblicazioni non sono intese come, e non costituiscono, consulenza o raccomandazioni finanziarie, di investimento, di trading o di altro tipo fornite o approvate da TradingView. Per ulteriori informazioni, consultare i Termini di utilizzo.