Hi Traders! Hope all you are doing well and doing good trades, So today I am sharing a clean technical setup which I’ve been tracking for weeks Tech Mahindra has finally given breakout from a multi-month falling wedge along with a horizontal resistance flip. The structure is now turning bullish, and the chart tells a very clear story.
Chart Observations-:
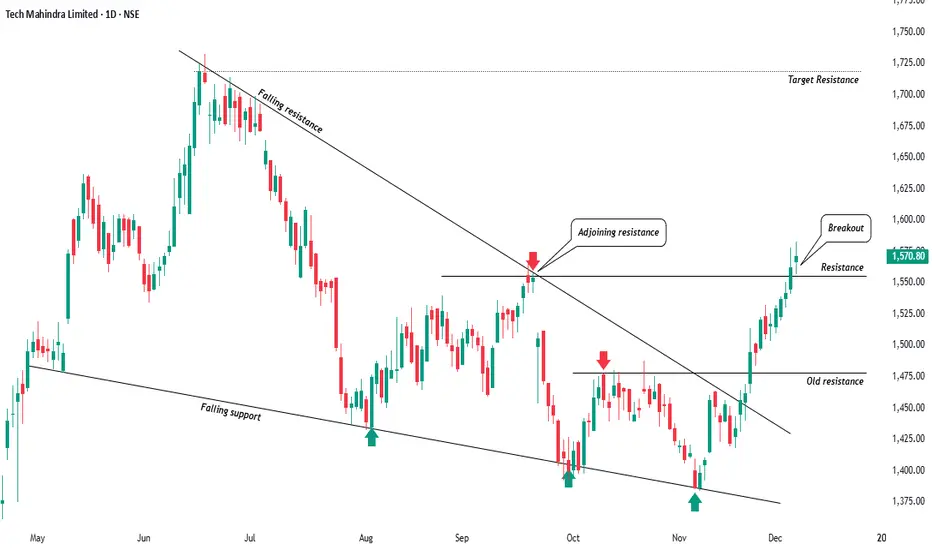
Falling Wedge Structure (May–Nov).
Price continued making lower highs and lower lows inside a narrowing wedge.
Both falling resistance and falling support have been respected multiple times.
Repeated bounces from the lower trendline (green arrows) indicate accumulation.
First Breakout Attempt – Rejection-:
Price attempted a breakout near the adjoining resistance in September.
Sharp rejection followed (red arrow), keeping the wedge intact.
This rejection later acted as a reference level for the final breakout.
Final Breakout with Strong Momentum-:
In early December, price decisively broke above the wedge’s falling resistance.
Breakout candles are wide-bodied and supported by rising volumes a strong technical sign.
Horizontal Resistance Flip-:
The stock crossed the old resistance zone near 1475 and then sustained above it.
This zone has now flipped into support, confirming bullish continuation.
The next major Target Resistance sits in the 1680–1720 region the logical wedge target projected from pattern height and price resistance too.
Technical Summary-
Pattern: Falling Wedge (bullish reversal)
Breakout: Clean and decisive
Market Structure: Lower-highs broken → Higher-highs forming
Resistance target: 1720
View: Bullish as long as price sustains above recent breakout zone.
This is one of those setups where price action aligns perfectly with classical charting principles.
Target is nearby 11% from current price so 1:2 Risk to reward looks good for me, Rest I will update the idea accordingly guys.
Thanks for reading.
Regards- Amit.
Chart Observations-:
Falling Wedge Structure (May–Nov).
Price continued making lower highs and lower lows inside a narrowing wedge.
Both falling resistance and falling support have been respected multiple times.
Repeated bounces from the lower trendline (green arrows) indicate accumulation.
First Breakout Attempt – Rejection-:
Price attempted a breakout near the adjoining resistance in September.
Sharp rejection followed (red arrow), keeping the wedge intact.
This rejection later acted as a reference level for the final breakout.
Final Breakout with Strong Momentum-:
In early December, price decisively broke above the wedge’s falling resistance.
Breakout candles are wide-bodied and supported by rising volumes a strong technical sign.
Horizontal Resistance Flip-:
The stock crossed the old resistance zone near 1475 and then sustained above it.
This zone has now flipped into support, confirming bullish continuation.
The next major Target Resistance sits in the 1680–1720 region the logical wedge target projected from pattern height and price resistance too.
Technical Summary-
Pattern: Falling Wedge (bullish reversal)
Breakout: Clean and decisive
Market Structure: Lower-highs broken → Higher-highs forming
Resistance target: 1720
View: Bullish as long as price sustains above recent breakout zone.
This is one of those setups where price action aligns perfectly with classical charting principles.
Target is nearby 11% from current price so 1:2 Risk to reward looks good for me, Rest I will update the idea accordingly guys.
Thanks for reading.
Regards- Amit.
Declinazione di responsabilità
Le informazioni e le pubblicazioni non sono intese come, e non costituiscono, consulenza o raccomandazioni finanziarie, di investimento, di trading o di altro tipo fornite o approvate da TradingView. Per ulteriori informazioni, consultare i Termini di utilizzo.
Declinazione di responsabilità
Le informazioni e le pubblicazioni non sono intese come, e non costituiscono, consulenza o raccomandazioni finanziarie, di investimento, di trading o di altro tipo fornite o approvate da TradingView. Per ulteriori informazioni, consultare i Termini di utilizzo.