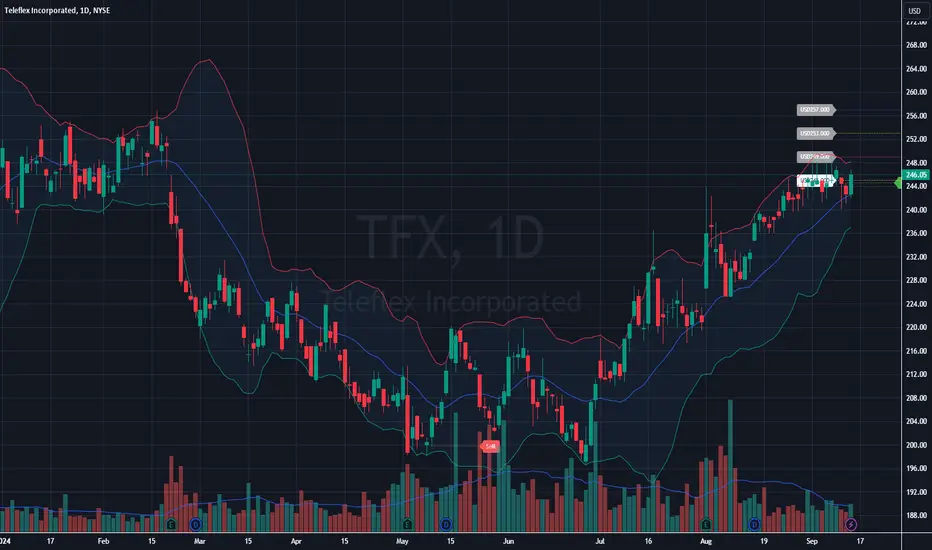
- There was a recent minor pullback, but the price is attempting to resume the uptrend as it has bounced back to the upper side of the Bollinger Bands.
- Middle Line (SMA): This line is being used as support, and the price bouncing off this level further supports the uptrend.
- In the most recent days, volume has decreased slightly, suggesting that the current move higher may lack strong conviction.
- Support: The recent low around $196.49 (lower Bollinger Band region) serves as key support.
- The 50-day moving average currently around $240 is also acting as dynamic support.
- Resistance: $252-256 represents an important resistance zone, as indicated by the highs in July and early September. If the price breaks above this zone, it could confirm a continuation of the uptrend.
- Current Bias: Bullish, with the price trading above the 50-day moving average and the middle Bollinger Band.
- Short-Term Outlook: The stock might experience a slight consolidation or pullback in the near term, as the price approaches resistance near $252-256. However, the broader trend remains up.
- Long-Term Outlook: As long as the price stays above the 50-day moving average, the overall trend is bullish.
➀➁➂➃➄
Declinazione di responsabilità
Le informazioni ed i contenuti pubblicati non costituiscono in alcun modo una sollecitazione ad investire o ad operare nei mercati finanziari. Non sono inoltre fornite o supportate da TradingView. Maggiori dettagli nelle Condizioni d'uso.
➀➁➂➃➄
Declinazione di responsabilità
Le informazioni ed i contenuti pubblicati non costituiscono in alcun modo una sollecitazione ad investire o ad operare nei mercati finanziari. Non sono inoltre fornite o supportate da TradingView. Maggiori dettagli nelle Condizioni d'uso.