🔎 Overview
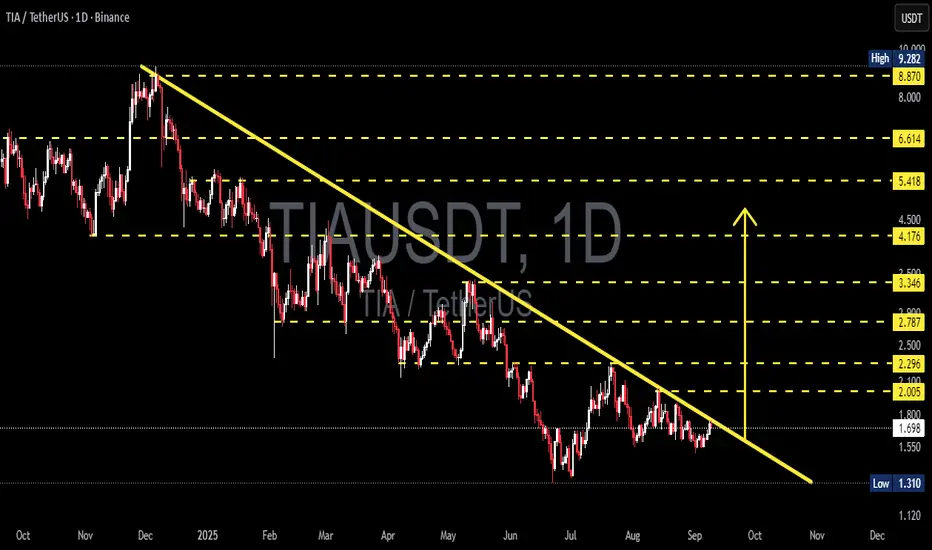
The daily chart (1D) of TIA/USDT shows that price action remains within a clear medium- to long-term downtrend. This is reflected by a series of lower highs & lower lows, all connected by the dominant descending yellow trendline.
Right now, the price is sitting at a critical crossroads — testing the trendline after months of trading below it. This is the moment that will determine whether TIA is ready to begin a bullish reversal or continue its extended bearish cycle.
---
🟢 Bullish Scenario
If TIA manages to break and close above the descending trendline with strong daily volume, the probability of a trend reversal increases significantly.
Step-by-step upside targets (based on chart levels):
2.005 USDT → first psychological resistance.
2.296 USDT → key supply zone, strong seller area.
2.787 USDT → next breakout confirmation zone.
3.346 USDT → mid-term bullish validation.
Breaking above 3.346 could open the path toward 4.176, 5.418, and higher.
Important note: a breakout without volume confirmation is often a false breakout.
---
🔴 Bearish Scenario
On the other hand, if the price fails to break the trendline and faces rejection, sellers will likely regain control.
Downside possibilities:
Price revisits 1.55 – 1.60 USDT zone.
Stronger sell pressure could drag it down to 1.310 USDT (critical support).
A breakdown below 1.310 USDT with heavy volume may trigger a capitulation wave, sending price into deeper lows.
In short: as long as price remains under the descending trendline, the overall trend stays bearish.
---
📐 Pattern & Structure
Main trend → Continuous downtrend since peak around 9.282 USDT.
Pattern → Descending trendline resistance that has rejected every rally attempt.
Critical support zone → 1.310 USDT (structural base).
Potential accumulation area → 1.3 – 1.7 USDT, seen from repeated bounces.
This structure resembles a descending channel with base-building. A breakout would shift momentum from bearish to neutral-bullish.
---
🎯 Conclusion
Bullish case → Trendline breakout + volume → upside targets at 2.0 → 2.3 → 2.7.
Bearish case → Rejection at trendline → downside toward 1.55 → 1.31.
Key focus: market’s reaction at the yellow trendline will dictate the next major move.
We are at a decision point: either TIA breaks out to start a recovery phase, or sellers take control again for another leg down.
---
#TIA #TIAUSDT #CryptoAnalysis #Altcoin #Breakout #Bearish #Bullish #ChartAnalysis #PriceAction #SwingTrade #TechnicalAnalysis #RiskManagement
✅ Get Free Signals! Join Our Telegram Channel Here: t.me/TheCryptoNuclear
✅ Twitter: twitter.com/crypto_nuclear
✅ Join Bybit : partner.bybit.com/b/nuclearvip
✅ Benefits : Lifetime Trading Fee Discount -50%
✅ Twitter: twitter.com/crypto_nuclear
✅ Join Bybit : partner.bybit.com/b/nuclearvip
✅ Benefits : Lifetime Trading Fee Discount -50%
Declinazione di responsabilità
Le informazioni e le pubblicazioni non sono intese come, e non costituiscono, consulenza o raccomandazioni finanziarie, di investimento, di trading o di altro tipo fornite o approvate da TradingView. Per ulteriori informazioni, consultare i Termini di utilizzo.