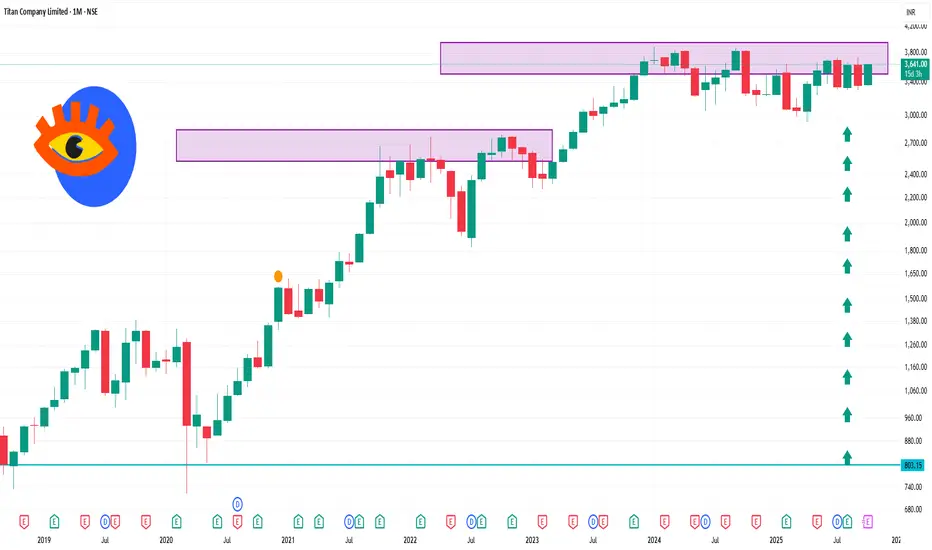
Titan Company Ltd is trading near ₹3,636.50, approaching its 52-week high of ₹3,740.
📊 1-Month Technical Overview
Price Performance: The stock has seen a modest decline of approximately 0.20% over the past month.
Technical Indicators:
Relative Strength Index (RSI): The RSI is currently in the neutral zone, indicating balanced buying and selling pressures.
Moving Averages: The stock is trading above its short-term moving averages, suggesting a positive short-term trend.
Stochastic Oscillator: The stochastic indicator is in the bullish zone, indicating potential upward momentum.
Commodity Channel Index (CCI): The CCI is above zero, signaling a bullish trend.
Rate of Change (ROC): The ROC is positive, further confirming bullish momentum.
Money Flow Index (MFI): The MFI is above 50, indicating healthy buying activity.
Support and Resistance Levels:
Support: ₹3,189.25
Resistance: ₹3,559.25
Pubblicazioni correlate
Declinazione di responsabilità
Le informazioni e le pubblicazioni non sono intese come, e non costituiscono, consulenza o raccomandazioni finanziarie, di investimento, di trading o di altro tipo fornite o approvate da TradingView. Per ulteriori informazioni, consultare i Termini di utilizzo.