Monthly logarithmic chart on total3 suggests it could 44x!
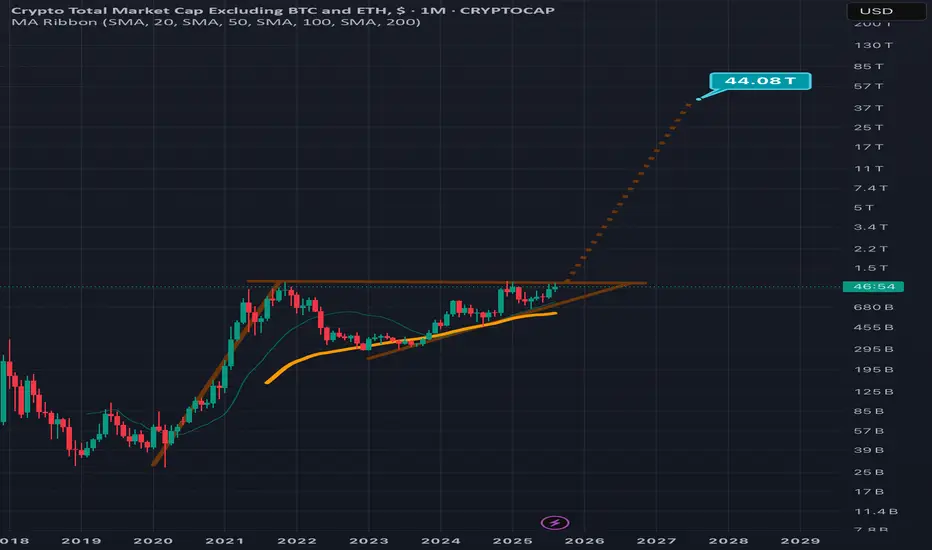
On the total3 chart we can see the majority of altcoins (excluding ethereum) have been consolidating for quite a long time in this ascending triangle which s also a bullish pennant. These patterns break to the upside far more than they break to the downside and this current one is nearing its apex. If we clued the pole of the pennant to calculate the Bullish breakout target/measured move, we can see that the target is 44 x higher than the current price. Of course this beng a logarithmic scale pattern, it may not ht its full 100% breakout target for multiple years even, but the angle of the measured move line does suggest we could see it reach such heights by 2028 and possibly even before it. *not financial advice*
Declinazione di responsabilità
Le informazioni e le pubblicazioni non sono intese come, e non costituiscono, consulenza o raccomandazioni finanziarie, di investimento, di trading o di altro tipo fornite o approvate da TradingView. Per ulteriori informazioni, consultare i Termini di utilizzo.
Declinazione di responsabilità
Le informazioni e le pubblicazioni non sono intese come, e non costituiscono, consulenza o raccomandazioni finanziarie, di investimento, di trading o di altro tipo fornite o approvate da TradingView. Per ulteriori informazioni, consultare i Termini di utilizzo.